

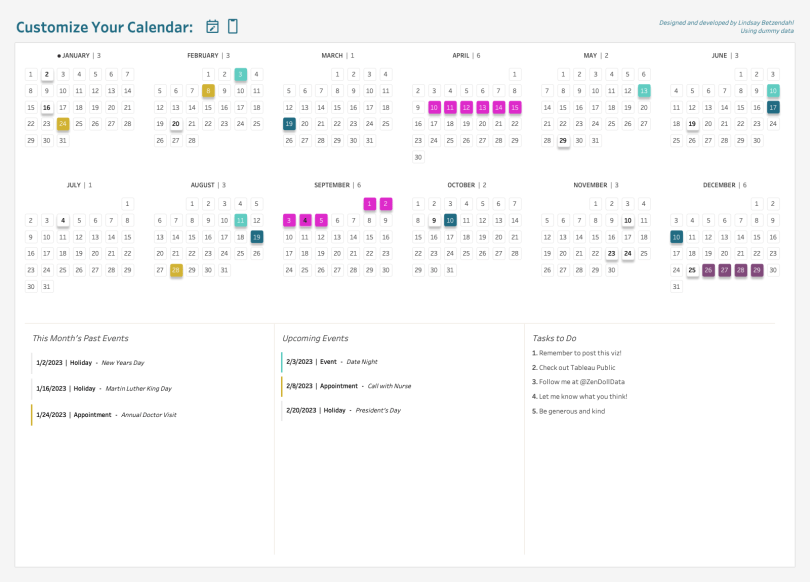
Recently I shared a post on how to create a dynamic calendar that adjusted it’s layout based on a parameter selection which included the ability to insert your own data using files that I made publicly available.
The calendar visualization, created in Tableau, has two main elements that make it “customizable”. Part 1 was shared in a prior blog post and covered how to use parameter actions and calculations to change the number of rows/columns for the months of the calendar.
This post goes into detail on how to use dynamic zone visibility functionality in Tableau to change the placement of worksheets (upcoming events and task lists in this case) based on the calendar format size.
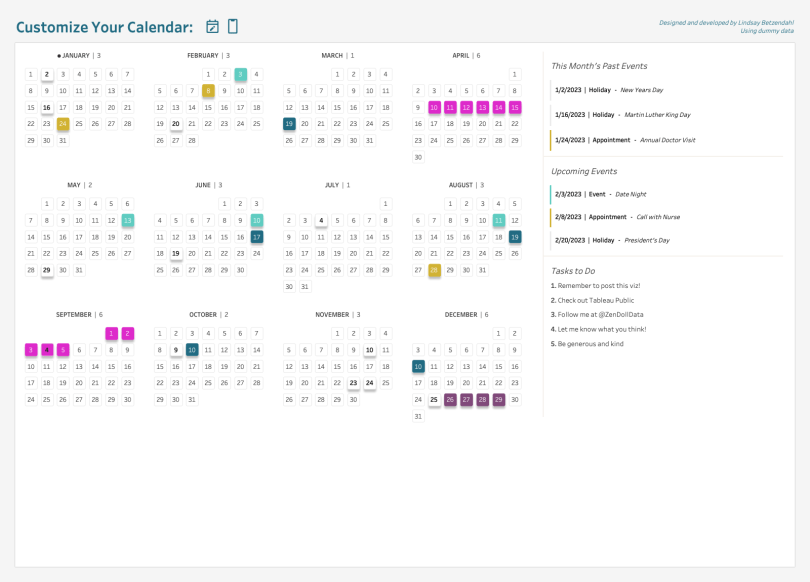
So think of it this way… If my calendar (or any chart for that matter) is short and wide then I want the other worksheet to be below it. But if my main worksheet is tall and narrow then I want my secondary worksheet to the right of it.
Dynamic Zone Visibility
Tableau Visionary, Marc Reid, has a great blog post about the release update that included dynamic zone visibility.
Think of dynamic zone visibility like advanced show/hide containers, but more accurately, as Marc describes, they are “data-driven object visibility as it’s not just containers but any object (or ‘zone’) – a chart, a filter, a text object, a web object, a download button or a container that holds any combination of these.”
The major difference between the original show/hide container and dynamic zone visibility is that the visibility of the object is based on a parameter or a value in your data. This can be driven by an action, which can be very useful.
However, it cannot currently be driven by a calculation or a field with various values. I find this limitation a bit frustrating. The parameter or calculation has to be a Boolean (true or false), a single value, or independent of the viz, meaning the field returns a constant value independent of the structure of the viz, such as a fixed level of detail (LOD) calculation.
Dynamic Calendar Layout
If you followed along in the prior post about creating the dynamic calendar, then the next step is to allow other parts of the view such as a worksheet showing the month’s past events, upcoming events, and a task list, to also “move” around the dashboard view when the calendar changes shape.
In order to achieve this behavior, I created 3 duplicates of the 3 worksheets listed above and one of each of which would be placed in 3 different containers on my dashboard. Only one container will be true for each of the parameter values. Remember, the parameter in my build controls the size and shape of my calendar (2, 3, or 4 rows of months).
Let’s start with one of the views to see how to set up dynamic zone visibility.
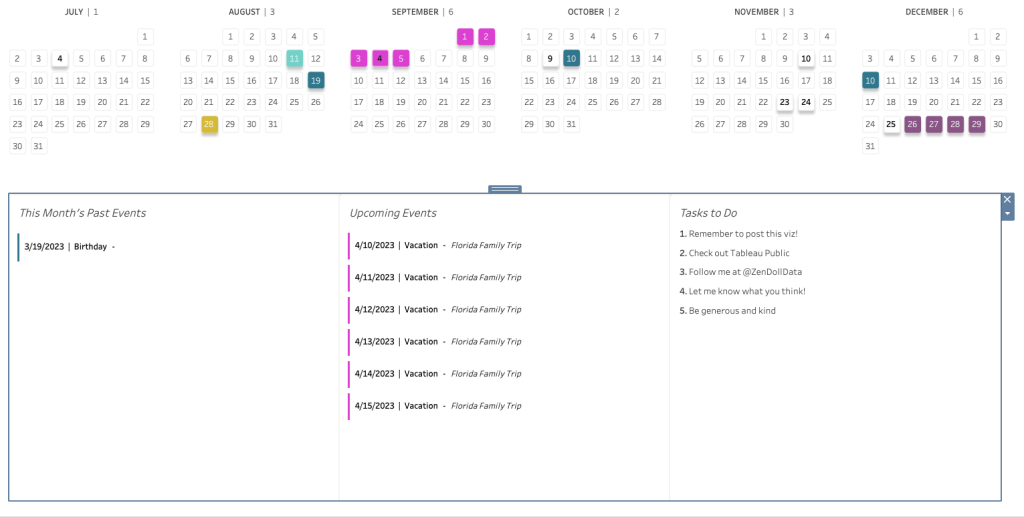
Step 1: Add a container to your dashboard and place the desired worksheets within it
In my view, I added in 3 worksheets (the month’s past events, upcoming events in the next 4 weeks, and a worksheet listing custom tasks). Because I wanted these worksheets to “move” their location based on the layout of the calendar, I needed the container to be shown below the calendar when the layout was set to 2 rows, but to the right of the calendar when it was set to 4 rows, for example.
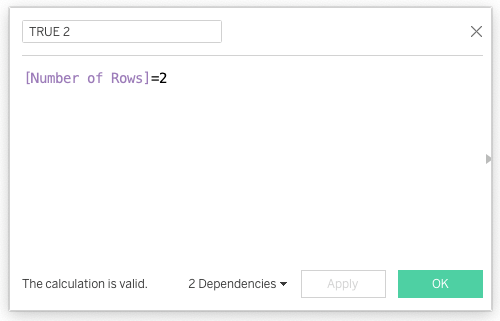
Step 2: Create a Boolean Calculation
If you checked out Part 1 of this viz build, you would know that my calendar changes layout based on a parameter with 3 values: 2, 3, and 4 – representing the row count for the calendar layout. So when the calendar layout (the parameter) is set to 2, I want the container with my 3 worksheets below the calendar to appear.
To do this, I created a calculation that references the parameter. Here, my calculation is the Number of Rows (my parameter) is equal to 2. So when the parameter is set to the value of 2, this calculation will be TRUE. Remember, dynamic zone visibility only works with a few calculation types, one is a Boolean.
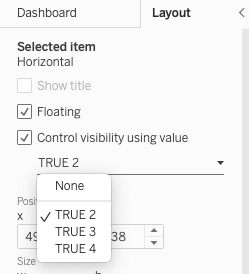
Step 3: Control the Visibility of the Container using the Boolean Calculation
Back on the dashboard, select the container and in the left Layout pane, check the box for “Control visibility using value” and choose your Boolean calculation. If you have a Boolean parameter, it would show up here as well. In fact, any valid calculation or parameter will show as options in the drop-down menu.
That’s it! Or at least for setting up one container to show/hide based on the parameter value. In order to have worksheets appear when other values are selected, you can follow the same process and place additional containers and worksheets on the dashboard hooked up to other Boolean calculations (such as Number of Rows = 3 and Number of Rows = 4).
Final Thoughts and Considerations
One of the challenges I have come across with dynamic zone visibility, is that containers likely can’t have a fixed size because you want other objects to take their place when the object is hidden. If the space is fixed, then the object will disappear but it’s space will remain. This is the same for worksheets within a dashboard. I found that I had to make my worksheets fill entire view and then allow the container to adjust size, but I had little control of the final view as Tableau was in control of dynamically resizing it.
Another issue was that Tableau currently doesn’t allow you to put the same worksheet in the dashboard more than once. This means for my concept, which really was to mimic worksheets “moving” around and adjusting their layout based on a user’s selection, I had to create 3 identical worksheets to go in each of the 3 containers I had on my dashboard. This was a bit of a pain, but worth noting.
As always, reach out if you have questions and I hope this was useful!
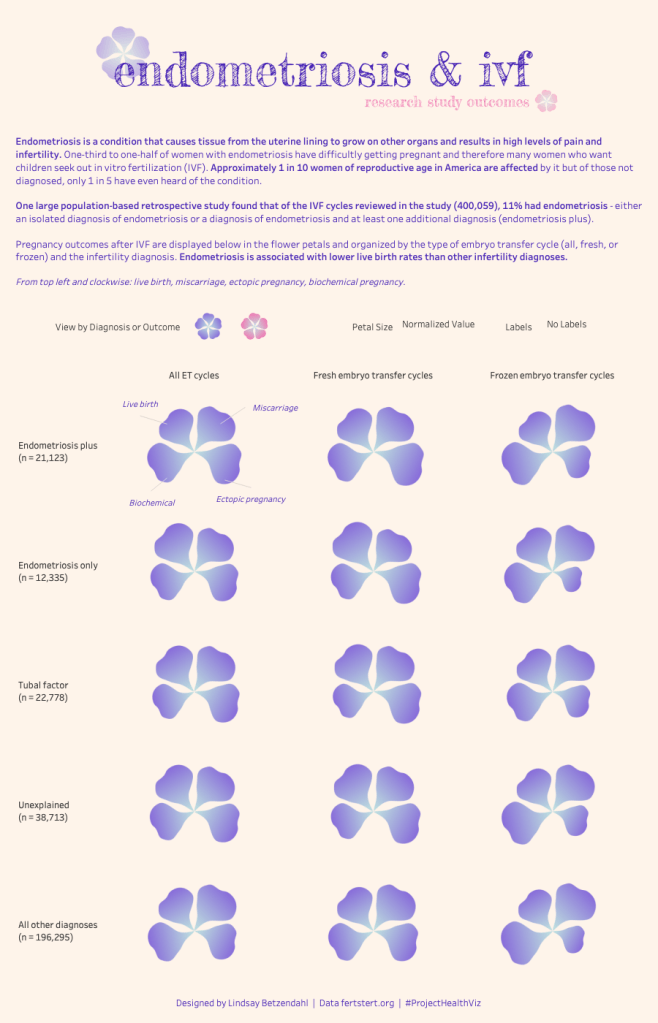
Here is the link to the final calendar viz as well as a few other examples of dynamic zone visibility, including a recent one I shared on endometriosis and IFV.
More examples of dynamic zone visibility for you to check out!
Kevin Wee – Visualizing Distributions
Ervin Vinzon – Superstore Dashboard
Marc Reid – Dynamic Zone Visibility
Soha Elghany – Dynamic Zone Visibility Guide
Cheers,
Lindsay

Hi Lindsay,
Thank you for your tutorial. As a Tableau newbie, I managed to recreate the calendar that is similar to yours. I’m trying to figure out how to include the days of the week (M, T, W, T, F) in this visualization but i’m unable to do it successfully. Any tips will be appreciated. Thanks again for sharing!
LikeLike
You could just type that into the month label. 🙂 I tried to share a pic but I can’t seem to do that unfortunately. Basically like this:
M T W T F S S
LikeLike