

Client Request: Filter Indicator
I was doing consulting work for a large healthcare client recently. As with many consulting jobs, clients ask for things that are not “out of the box” in Tableau. This means I usually answer their request with a hesitant, “Sounds like a great idea, let me see what I can come up with.” In my mind I’m often thinking, “What the hell!?! How am I going to make this work??”
However, it’s those challenges that really test our skills and make way for new innovations. I love these challenges as much as I fear them. Mostly because I don’t want to fail and say to the client that their request is “just not possible in Tableau” when I know that if I have the time to spin my wheels long enough I’ll get out of the ditch.
This request was a useful one so I’m going to share how to create it.
I was working on a set of dashboards that was designed to be a cohort selection tool – really a filtering tool that would result in a list. There were a number of metrics on each dashboard in graphical displays and the client wanted to be able to filter based on what they were interested in. Okay, easy – we added a ton of action filters that gave the client the ability to filter however they saw fit during their exploration.
The catch was that they wanted some indicator to tell them what filters they had applied. Initially, they asked if there could be a sentence: You’ve selected females, ages 20-24, who live with their parents. Well, you can imagine that would be a mess to develop and if they selected multiple values from the same dimension, it would be a disaster.
So my challenge was to create an indicator that only “went on” when the action filter was triggered and that I could use in the worksheet that the action filter was on.
Solution? LODS and Set Actions. Boom. Mic drop.
Before we move on… Do you want to see what I’m even talking about? Okay, you got it. 😉
Useful? If so, then keep reading.
The Indicator – How To
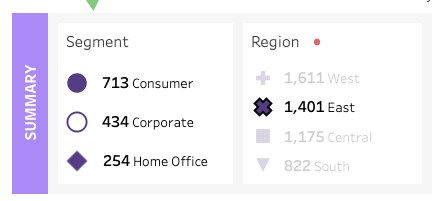
Above you can see that “East” is selected on a worksheet. That action filter is filtering “Segment” (as you can tell by the sum equaling 1,401), however, the actual “Region” worksheet is not being filtered as it’s just the source. So any attempt to do a COUNTD of the dimension values won’t work. Despite the fact that nothing is filtered on the source sheet, there is a red indicator dot that shows up when that worksheet has had an action filter applied.
Let’s break this down.
Step 1 – Build the Set
This trick requires Set Actions, so obviously let’s do that first. Right click on Region and select “Create Set”. Don’t select anything. Just name your set “Region Set”.
Step 2 – Create a Calculation
Create a calculation called “Filter Indicator-Region”. Keep this clear because you will need to build a set and a calculation for each field you are using as action filters on your dashboard. I realize this sounds like a lot of work, but it’s actually less work than my alternative which is creating the calcs and then additional dashboards. So let’s do this.
Your “Filter Indicator-Region” calculation will look like this:
IF SUM({EXCLUDE [Region]:
AVG(IF [Region Set] THEN 1 END)})>0 THEN ‘●’ ELSE ” END
Essentially, this calculation says if the Region Set is true then give it a 1. Not looking at any changes of the region in the view, if that average value is greater than 0 (which will be true anytime there is anything in the set) then give it a circle indicator. The calculation is just checking if anything is in the set.
Note, if you have a view that has more than one field, you need to add that to your Exclude clause. See my worksheet for Subcategory. I added in Category on color, so I had to add that in to my exclusion to make the calc truly work.
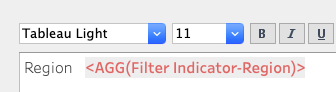
Step 3 – Put the Calc in your Title
Add that calc in your title. I gave mine a spacing of 4 spaces for some breathing room and colored it red and bold.
Step 4 – Hook Up the Dashboard Set Action Filter
After you add your worksheet to your dashboard, navigate on your menu bar to Dashboard and select Actions.
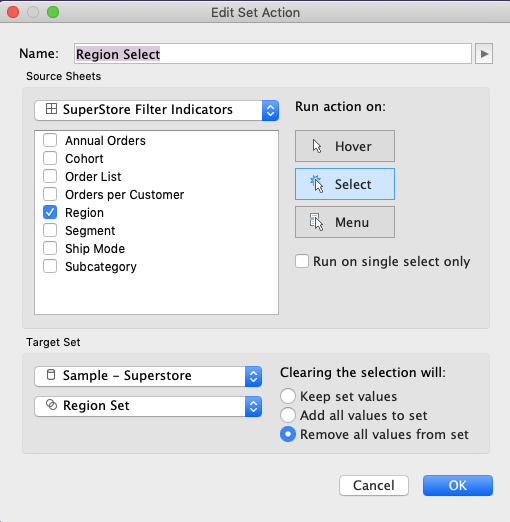
There select “Add Action” and select “Change Set Values”.
Name your new Set Action Filter “Region Select”. Select Region (or obviously whatever dashboard you are using that has the dimension you are going to be filtering on), run on Select, and then select the appropriate Target Set – Region Set. Be sure that under Clearing the Selection header “Remove all values from set” is selected. See image below.
Action Filter Indicators
Now that your set action is hooked up and your calculation is created the final part is setting up your action filters.
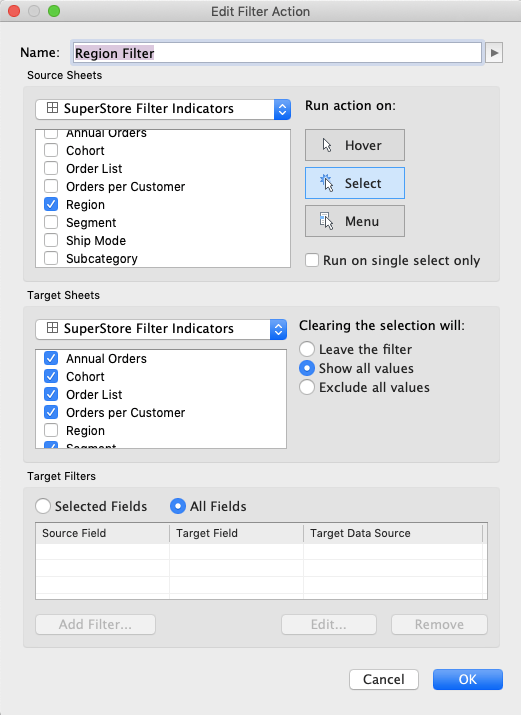
For the same worksheet, Region, assuming you have other worksheets to filter on your dashboard, again you can go to Dashboard – Actions and create a filter.
Identify the target worksheet (Region) and have it filter all relevant worksheets on your dashboard. Run on Select and Clearing the Selection should be set to “Show all values”.
Now, when you select a regional value, such as East, your action filter will filter the other worksheets on your dashboard, but also trigger the set action and therefore the calculation which will put that lovely little red dot in your title to show that the filter has been triggered.
Boo-yah. Your clients will thank me. Wait, they will thank YOU. 😉
One last point. Yes, technically you can see what has been selected via action filters since the marks become faded. However, if you have a dashboard with a number of worksheets and selections can become unruly, this is a way to use those pre-attentive attributes to direct your client’s eyes to everything they have selected.
Summary & Viz Link
As always, if you have questions or comments, please drop me a line on this blog or via email or Twitter (@ZenDollData). I’m happy to discuss!
If you use this trick, please let me know or show your inspiration in your Public viz! I’d love to see how this can be used.
The viz can be found here and is downloadable. Enjoy!
Cheers,
Lindsay

This is great. Love it.
Katherine Rowell, MS, MHA Founder and Principal | HealthDataViz.com cell (617) 797-6471 …………………………………………………. HealthDataViz
177 Huntington Ave Ste 1703 #57026 Boston Massachusetts 02115-3153
Check out our upcoming training programs
>
LikeLiked by 1 person
Hi nice readinng your post
LikeLike