

The Objective
In a recent #ProjectHealthViz visualization, I created a very narrow (and overall quite small) dashboard. As a result, I didn’t have a lot of room for my charts and required “space-saving” chart types, including the trellis chart – a chart repeated across a grid.
I’ve reviewed how to create a trellis chart in a previous post.
My goal was to show summary details (overall appointments by doctor, total cost by doctor, average cost per appointment) as well as the percent the family paid from the total cost of the treatments.
To achieve this I created a progress slider bar that would show the percent along a line from 0-100 as well as a detailed text header.
I could have easily made a trellis of bar charts, but I wanted to reduce the data ink in order to keep in line with some of my other design elements.

The Progress Slider
This particular chart, what looks like a progress slider, is really just a thin bar chart and a circle on a dual axis.
We will use the original data set to make this chart, which you can find here.
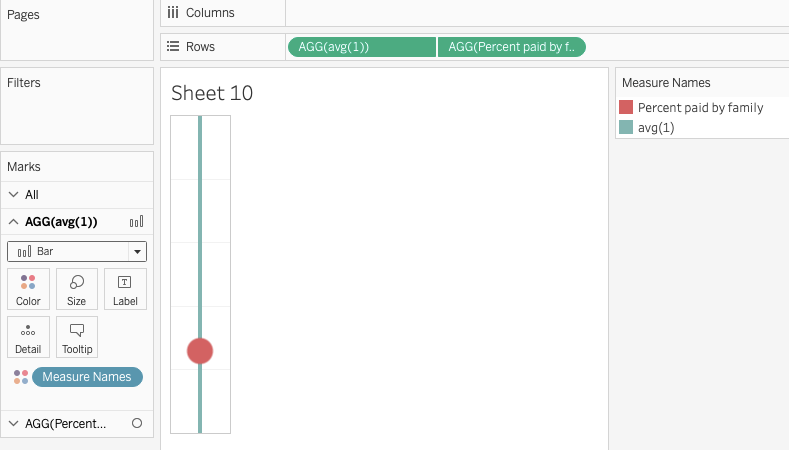
To create this, type AVG(1) into the Rows shelf, fix the axis from 0-1, and make the bar very thin. In my example, I placed a bunch of aggregate information into the bar to show the overall costs and counts of appointments.
Next, create the percent calculation you want to chart along the progress line. In my case, I used the SUM([Out of Pocket])/SUM([Cost]). Go ahead and create this calculation and call it “Percent Paid by Family”.
Place that calculation on the Rows shelf, set to a circle, create a dual axis, and then synchronize the axes, and remove the headers. You should have this view:
Trellis chart
As I mentioned, you can find details to the Trellis chart on another post of mine. However, it’s relatively simple. We need two calculations: Rows and Columns.
Row: int((index()-1)/(round(sqrt(size()))))
Column: (index()-1)%(round(sqrt(SIZE())))
They will default to a measure, but go ahead and move them to dimensions. Then place Rows on the Rows shelf and Columns on the Columns shelf.
Nothing will look different.
We have to set the level of detail by which to create the grid and then change both the Rows and Columns calculations to “Compute Using” that dimension.
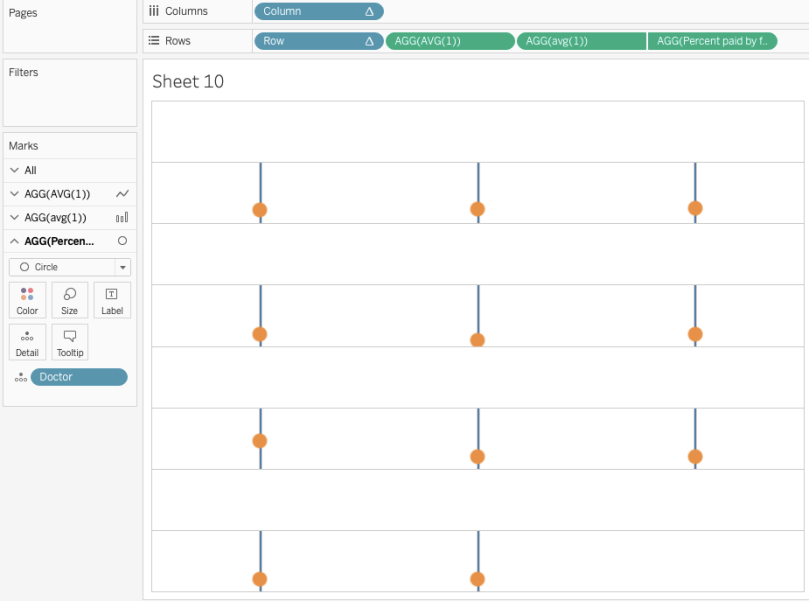
Drag “Doctor” to the detail shelf for both the bar and the circle. Right click on the Rows calculation and set it to “Compute Using” Doctor. Do the same for Columns. Then hide the headers and grid lines.
Your chart should look like this:

The next step is to add the header part and format the chart.
The Header Text
Next, add another AVG(1) calculation to the Rows shelf right before your dual axis calculations. You can find a video with a similar explanation by Lorna Eden here.
Change the mark type of the new AVG(1) calculation to a line, adjust the size to the smallest, reduce the opacity to zero. After adjusting the sizes of the marks, your chart should look like this:
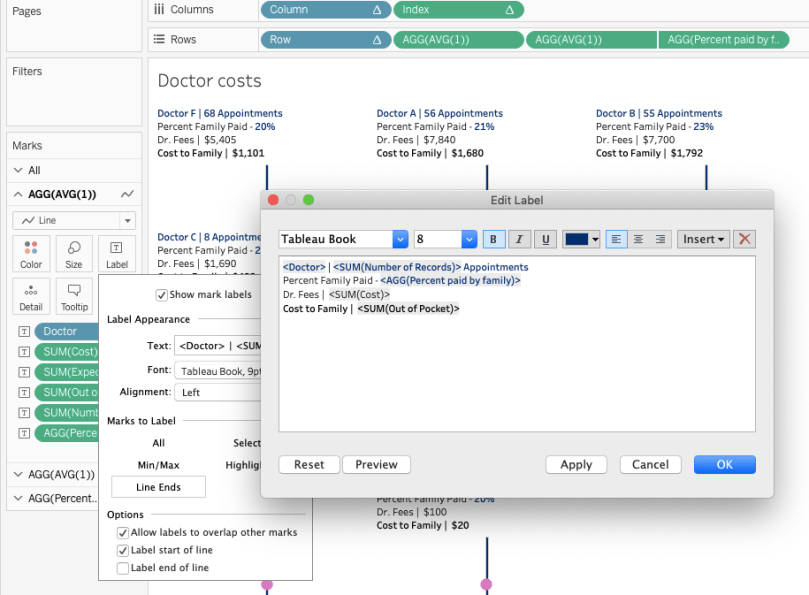
Now, in the space where there is out “hidden” line, we can add in our header text. By adding your other details to the text mark card, such as Doctor, Number of Records, and Cost, etc. then you can format the header as you wish.
However, the view appears to break when you add in the other details. To correct this, type INDEX() into the columns shelf and compute using across. Fix the axis from 0-2, to center the line. Then your view should adjust and look like this:
There you have it! A progress slider bar in a trellis chart! This may be a very specific use case, but that concept of packing information into a tight space with minimal ink is useful. As I mentioned at the beginning. I could have done a regular bar chart, but with the dual axis, I was able to put different information in each tooltip.
I encourage you to check out the interactive visualization here.
As always, if you have questions, don’t hesitate to reach out via email or on Twitter (@ZenDollData) or LinkedIn.
Cheers,
Lindsay

3 comments