

The Artist From Within
Last night I presented at the Philly TUG on my Tableau journey, about #ProjectHealthViz, and what it’s been like to be a consultant in the data viz space. After my talk, someone from the audience asked me, “Where did you get your visual design talents?”
I struggle with answering this question often. Mostly because I don’t find my design skills that “talented” but also because it’s easy for me to avoid the question by saying, “Well my mom is an artist, so there is that.” People usually accept that answer as if biology just made me good at something because my parent is amazing at it.
So that was the first thing out of my mouth. But, truth is, I don’t believe that to be the reason.
Our Gravitational Artistic Pulls
The reality may be much more simple and less interesting.
I believe that, yes, some people may develop talents of their parents due to biology and our genes. You may be a great musician because your parents are. Or fantastic at science because your parent was a professor of chemistry. However, because the intersection of nature and nurture is so blurred at times, your natural abilities may be more about exposure than pure talent.
My design talents, if you will, are likely more about what I’m naturally drawn to–what I like–that what internal abilities I may have. That means, that I draw from what I see, we all do to some extent. So I use colors I enjoy, or frankly that are around my office, I use layouts that I’ve used before or I see and whether I know it or not consciously, I’m always learning from my environment and honing in on those skills.
For example, Zach Bowders recently created a viz on video game sales, which at first I think I told him I was confused and overwhelmed. Bubble charts are not the best way to show any data and there were lots of colors. I mean lots. However, and this is very important however, he loved it. Zach was drawn to the bubbles and the colors. It was a vibrant and fun viz. It was eye-catching and exploratory. In fact, he created a few more vizzes after this with bubbles, because, hell he liked them!
Our talents are often what we are drawn to. What we like. What we find enjoyable. I also believe there is another aspect to how we intersect with our visualizations, and that is the human component–how we add our own flair, our story, our likes or dislikes into our vizzes.
The vizzes of mine that I like the most, are the ones that are clearly me. Ones that I enjoy for various design aspects, but others may not. They resonate with me and feel, well, just right.
Intersection of Human and Data
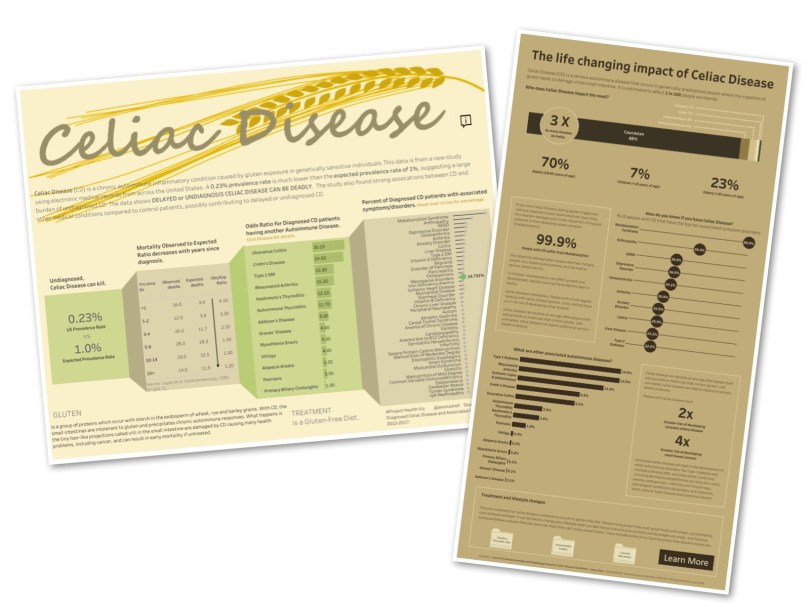
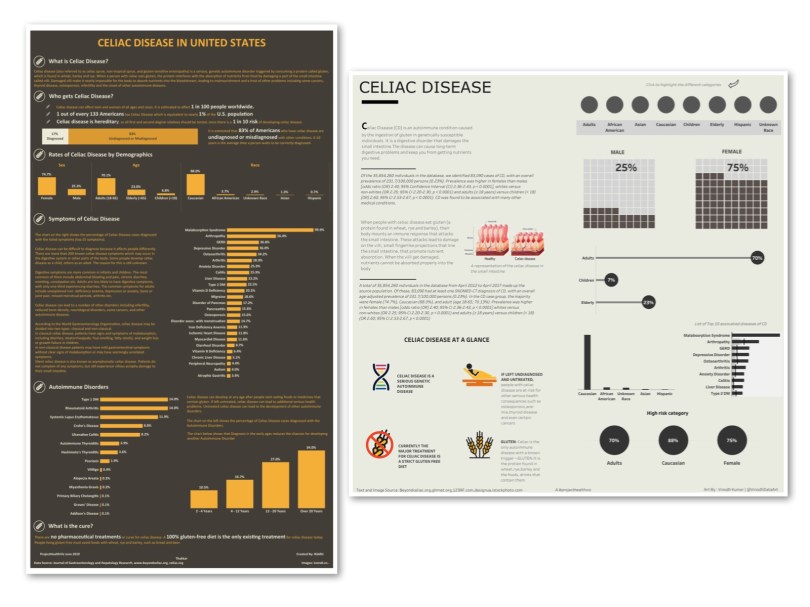
June’s #ProjectHealthViz focused on a meta-analysis of Celiac Disease, or CD, which is an autoimmune condition caused by the ingestion of gluten and can damage the small intestine and cause long-term problems. CD can come with many other non-gut related illnesses such as malabsorption syndrome, arthritis, migraine headaches, and depression.
As with months prior, many participants used aspects of the data that resonated with them and they are able to share personal stories, or add details that may not have been in the data set.
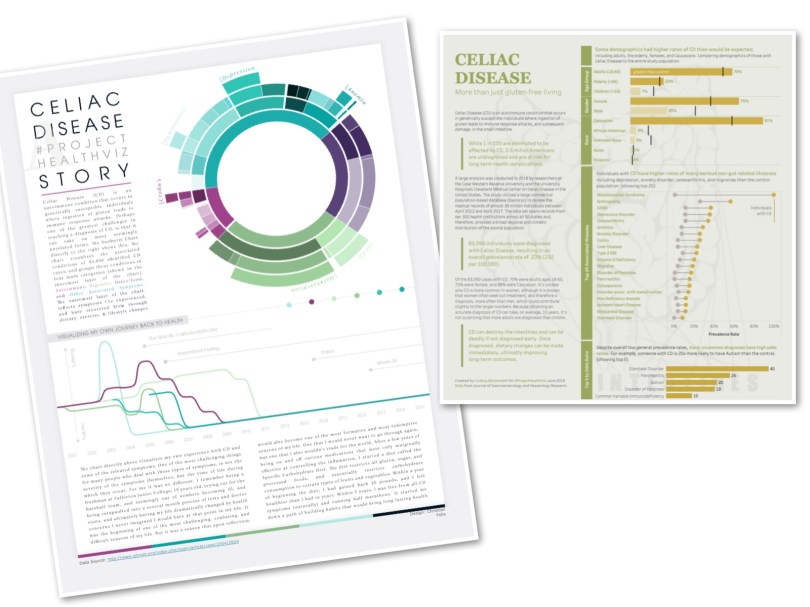
For example, Christian Felix used the data set as an opportunity to share his own story with CD and how he was able to overcome many of the symptoms and challenges associated with the disease. The dashboard flows like a beautiful article in a science magazine. While the sunburst chart has few practical uses, I believe it works here to show the categories of the various diseases followed by the ones that Christian experienced.
The remaining section of the viz is about his own journey with the select diseases. This means he didn’t use all of the data that was provided and I applaud him because I sometimes struggle with letting go of some of the data.
To drive that point home even further, #projecthealthviz is fundamentally about “telling the stories of our health.” This means it could be telling the full story of the data, telling your own story using the data, or telling only a portion of the story because a piece resonates with you.

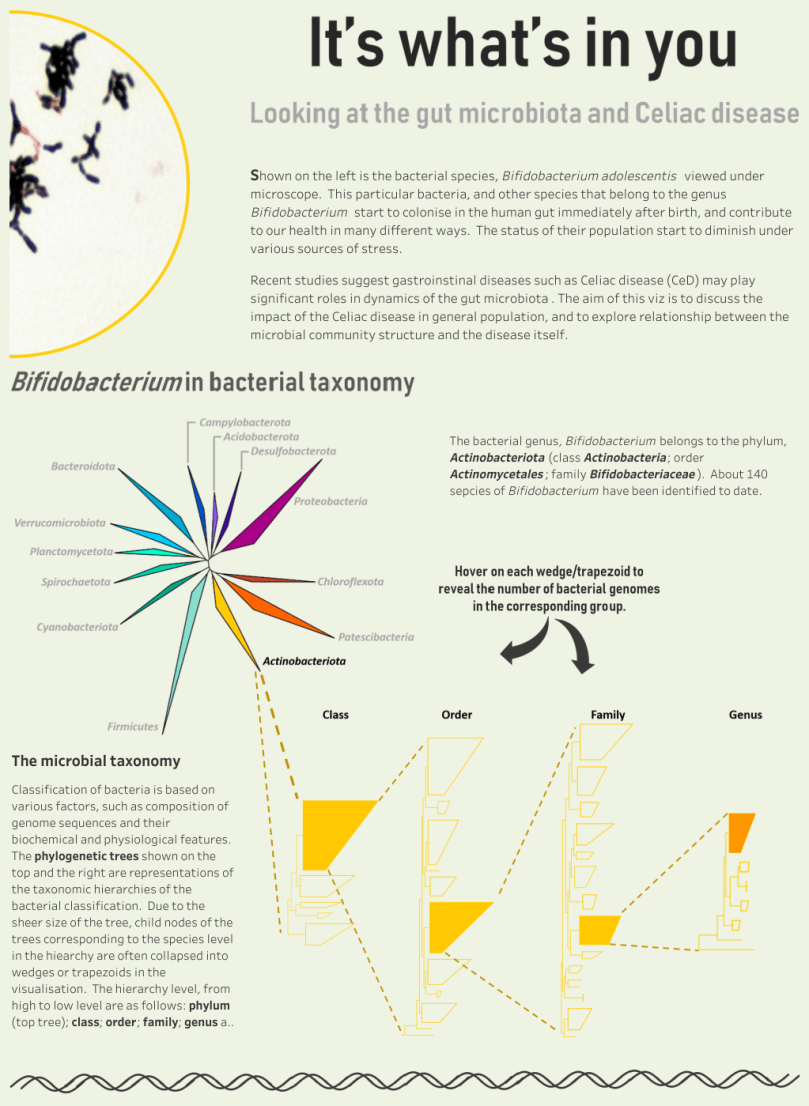
Young Song is another example of someone who intersects with his vizzes. As an expert in microbiology, and with a unique style all his own, his vizzes are rich with information about microbiology and provide a deep-dive into the science behind so many common things, such as soil, superbugs, deep ocean biology, and viruses. They are all quite fascinating.
In his Celiac Disease viz, Young focused on the bacteria in our gut and the relationship with Celiac Disease, but in order to tell the whole story, he first explains the taxonomy of bacteria through some unique and beautiful diagrams. The diagrams are cleverly created with a background image with polygons. The image looks exactly as you see it, but the polygons over top add the tooltip information so that the viz is interactive.
The entire story flows from there: taxonomy details on the bacteria in our gut, how microbes change as we age, the various microbes in male and female guts, how microbes interact/affect Celiac Disease, and the associated diseases someone can have along with CD. It’s definitely a viz worth checking out!
All the vizzes this month told the story about CD and each used different elements of Tableau to make them unique. Go check them all out! Links to all of these are in the submission tracker viz, which you can find here.
Cheers,
Lindsay


I picked up on this post from your Twitter feed. The bit at the beginning of this article caught my attention “where did you get your visual design talents”. I came up with a model quite some time back in relation to hiring people or assigning them to projects. I think someone’s ability to do something is a function of : (i) natural ability, (ii) training, (iii) experience and (iv) motivation. I’m guessing that you score highly on all four axes in relation to data visualisation and that’s why you’re good at what you do. I also use the model to work out why someone may not be achieving what they want to. By getting an insight into which of the axes they are deficient in often leads to an effective improvement action being taken.
LikeLike