My boss, Kathy Rowell, is a huge expert in the data visualization space. It goes without saying that when you are good at something you often develop phrases to enhance your points. She has a frequently used saying heard in trainings to reminds us that sometimes you need to pick your head up and step back from the work we are doing. Look up from the details and think about the bigger picture. The story. The message. The context.
The expression is, “You can’t see the forest for the trees,” which means that if you are so focused on the details (the data) that you may miss seeing the big picture (the story). In relation to data visualization, that expression reminds me about how we find stories from all the individual pages of data.
Storytelling is a Skill
In our day jobs we often don’t have the luxury of deciding ‘what story do I want to tell’ from a data set. Especially for the usual management or executive dashboards, the scope is often to give some high-level perspective of key metrics, perhaps some comparisons (such as this year to last year), some important but simple charts, and drill-down options to dive further into what may be contributing to values in those key metrics. Or it’s meant to monitor over time so the ‘story’ inevitably may change. Or someone else may have already told you what story they want to hear.
However, that doesn’t mean that the practice of curating a story from a data set, as we often do in public community projects, isn’t valuable. It’s super valuable.
I remember frequently getting stuck in #MakeoverMonday data sets by thinking I had to use every data point to tell the story. I struggled with this a ton, but finally realized, that knowing what data to use was just as important as knowing how to use it.
I’m not perfect at it, but I have learned to let go of data. In order to do that, I need to, ironically, almost practice a KonMari approach and thank every measure and dimension before telling myself I can let go of it.
However, it’s still important to understand the data before making those decisions about what to use or not to tell the story.
I feel like sometimes this is like walking through a field of tall grass, or wheat. Imagine walking and touching all the tall blades. Feeling them brush against you. This is where you absorb the meaning of each data point. You get in the weeds, as they say. I play with the data before I decide, what can I let go of? What can I embrace? What do I need to tell a story? To tell the story?

It’s No Invisible Ink
Here is where the magic happens as analysts/data visualizers/developers/creators. Here is where you determine, what is powerful? What is interesting? Why is it interesting? What isn’t interesting and why? What do I care about? What will others care about? Is is all necessary? What can be done about the findings? How will others engage with it?
Visual storytelling is no invisible ink. In the data viz space, when you tell a story, you put it out there for all to see. That is the inherent fun of data visualization – you make information come to life. That means, it’s important to decide on what you want to share and how you want to share it.
I may be on an island here (though I doubt it given others in the community), but healthcare data has a curious way of penetrating deeper into my psyche than other data does (data on animals – other living creatures – also has a similar effect) because underneath the numbers are people. REAL PEOPLE.
Let’s pause. (Don’t worry, I’ll get off my soap box in like 3 seconds.)
Stories are built and told by people. Healthcare data is information about people. Healthcare visualizations are beautiful stories about people and told by people through visual mediums.
Okay, back to my point. Practicing the skill of storytelling, which is awesome.
Honing in on One Chapter
So how do people find stories for their visualizations?
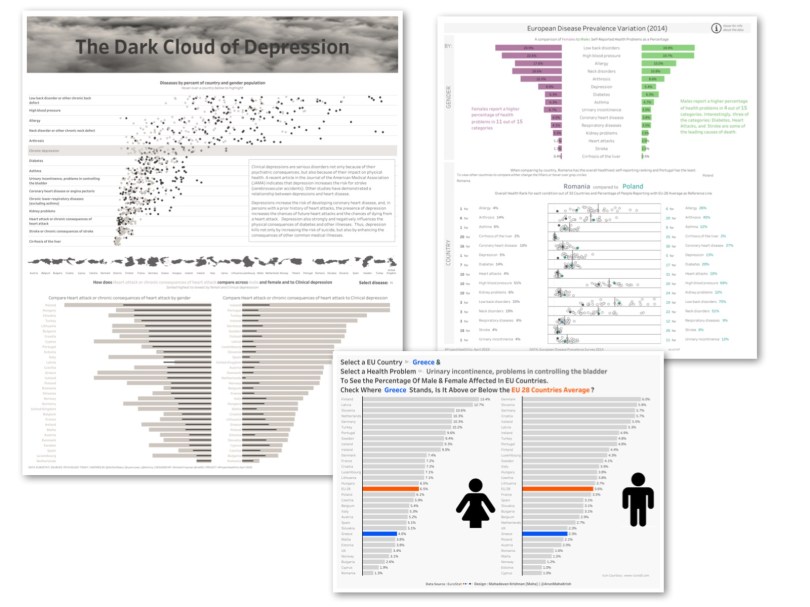
April’s ProjectHealthViz data set was from EuroStat’s analysis of various European countries sharing self-reported rates of a selection of health conditions from asthma to high cholesterol to urinary incontinence with a comparison of male to female and the total population.
A number of people this month chose to focus their story on one health condition. While this drastically limits the data set is does not limit the story.
This is evidenced by Zunaira Rasheed‘s recent Viz of the Day for her visualization on Arthrosis. She found a story fueled by a family connection to the disease. Her viz simply looked at the comparison between the rates of men and women who had arthrosis within each country. Contextually, she added information about the disease, the causes, symptoms, risk, and ways to reduce the impact of the disease.

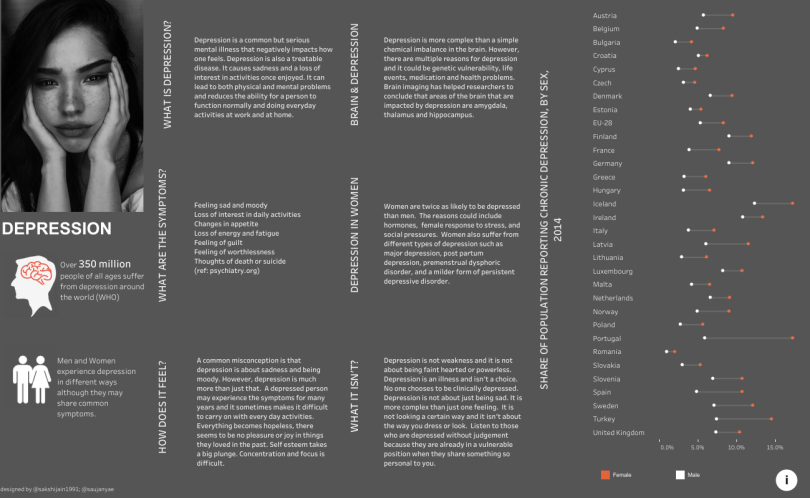
Another example was a collaborative viz by Sakshi Jain and Saujanya Ram that focused on depression.
Driving the Story with the Title
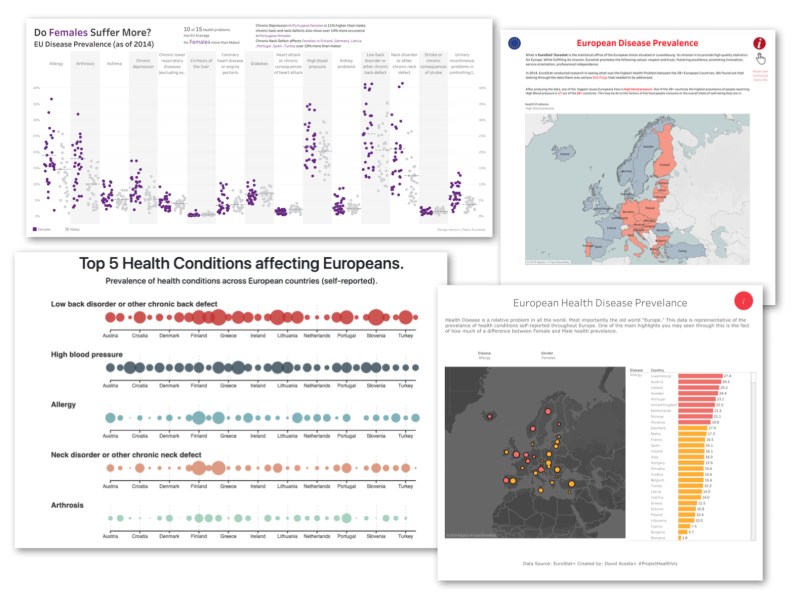
In other cases, the stories were much broader. Some decided to pose questions to the audience, such as Ash Shih who simply wondered in his viz, “So women may live longer, but do they have a higher percent of problems?” Or Pratik Chaudhary who questioned in his viz if the health conditions were gender specific or not. Here the titles posed a question which the visualization attempted to answer, but the ultimate answer is left to the viewer who can interact and explore the data and find the story.
Titles don’t have to be catchy or covered in a unique font. Title just have to tell the beginning of the story or share the topic that the visual is about. Nothing more, nothing less.
Tushar More, Riddhi Thakkar, and myself used variations on a simple title: European Disease Prevalence. We each used most, if not all, of the data and left the exploration to the viewer. There are still stories in these visualizations even if text and context is not spelled out. Here we allow the viewer to find their own story. What do they want to know? What interests them? What findings do they uncover from exploring and engaging with the data?
Practicing Storytelling with Data
The lesson in all of this is to try out many storytelling methods. While this isn’t a comprehensive list, I’ve shared a few common ways in which we use visualizations to tell stories.
- A clear curated message, often focused on on aspect of the data or one result.
- A posed question to the viewer, which is often partially guided to an answer, but ultimately left to the person interacting with the visual.
- An open-ended story, which usually take all or most of the data and casually directs the viewer to engage in particular ways in hopes that they develop their own stories and insights.
So I challenge you to think about what types of stories you tell and how you use the data sets provided to you. Practice with varying methods of both visualizing, but also telling stories.
You can check out all of the vizzes from April below and search for the folks on Tableau Public to check out their vizzes!
Cheers,
Lindsay