

The Inevitable Comparison
Many of you reading this already know that I’m a mom of two young boys, a wife, and I have a full-time career in the data viz field. None of this is terribly unusual or unique. In fact, there are plenty of moms, wives, dads, husbands, partners, full-time workers, part-time workers, and all other sorts of people who are in the data viz field. Clearly, we are a diverse group with unique perspectives, varying amounts of engagement in the Tableau Community, and different resources or access to time to do so.
Not long ago, I felt myself feel a little defeated when I saw some friends share amazing and complex visualizations on Tableau Public and many followed-up with a thoroughly detailed blog post about the viz. I admit, it’s not something I’m proud of, but if we are all honest, we can’t help but compare ourselves to others now and again. My immediate thought, which I also immediately hated that I had, was “Ugh, I wish I had time to do that.” I probably also said to myself, “Must be nice,” in a sarcastic tone.
My second thought was, “What can I do about it?” and “Why am I responding this way?” The therapist in me did a little self reflection and discovered a few answers.
- Reflect on your reactions. They are usually about you not the other person.
- Define clearly your goals and aspirations. Your goals shouldn’t be those of others and do not need to be of the same quantity, duration, or intensity. They are yours.
- Reevaluate time. All the choices you make require time and it’s only up to you how you structure that.
- Connect and support others. Both those who are similar and those who are different.
The Choices We Have
Comparing yourself to others can be a double edged sword. On one side, you may compare your differences and feel inadequate, excluded, or perhaps, even, jealous. Recently, Andy Kriebel posted on Twitter the following statement:
Envy: Wanting what others have AND wanting them not to have it. It’s one of the seven deadly sins and contrary to the virtue of gratitude.
I actually responded to this, referencing a lesser known word: compersion.
It’s not actually found in the English Dictionary but other languages have varieties of the word. Compersion, according to Wiktionary, means the feeling of joy one has experiencing another’s joy, such as in witnessing a toddler’s joy and feeling joy in response. It’s when you feel happy for someone else’s successes. Other people suggested “abundance” or “vicariously happy” to express the same feeling about being happy for other people’s successes.
Now the other side of comparing yourself to others, is that you can feel motivated, encouraged, or empowered to succeed if you use the energy to make changes. You may also feel accepted, similar, reassured, or content with the acknowledgement that others share similar experiences.
The challenges is to use how you compare yourself to your benefit – for positive growth, versus to take yourself of others down.
It was important to me to connect people who felt the same as I had. I wanted to raise them up in any small way to show them that “I get you; you are not alone.” We are more similar than the virtual social space allows us to understand.
My Response
I knew I wasn’t alone feeling that I wanted to fuel my data viz passion, but that time was a scarce resource. I prioritize my family life (as many do) and with two boys, who never stop moving, that means I rarely sit down and it’s rarely quiet in my house before bedtime. That translates into: little time for hobbies or extra activities such as vizzing.
However, this reflection gave me an idea. I reached out and spoke to a number of mothers in the Tableau Community who shared with me that they wished they had more time to be involved and create personal visualizations. I knew time was one of the biggest hurdles in order to get this done. Beyond time, a huge component to foster engagement is support. Just the act of praise, showing empathy, and creating an environment of trust and collaboration, can be all someone needs to become involved.
I decided that I wanted to give back to the moms (or mums depending on your location) out there and create a viz that demonstrated while we parents are similar, we are unique. I wanted a “landscape” that other women, perhaps with limited time, could download the workbook, update it with their personalized data and quickly have a viz that shared who they were.
Many women I spoke with hadn’t had time to engage in community data initiatives or publish much to Tableau Public but had a desire to do so, so I thought this would be a method to help them at least create one viz – and hopefully one that was fun!
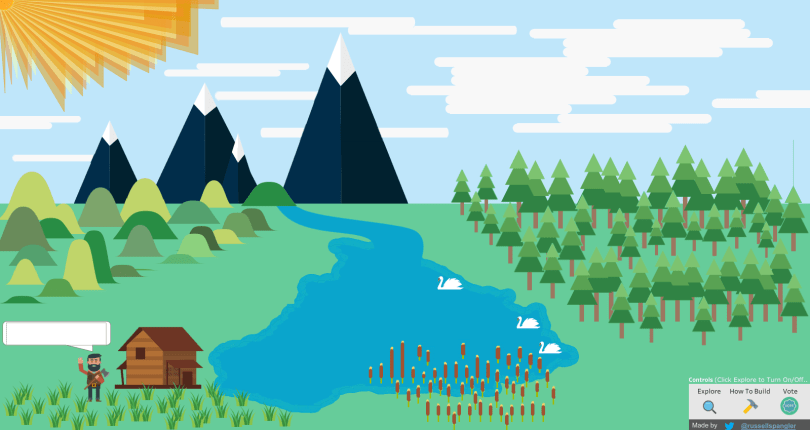
The Landscape Inspiration
During the 2018 Iron Viz season, Russell Spangler submitted, what I thought was, an awesome visualization using data from a trip he took over the summer. He took his data and transformed it into a landscape. Now, I needed to come up with something simple and easily modifiable to others, so I used the idea as a launching off point.
Let’s be clear, mine is much less complicated and took me about two weeks to put together. It was an hour here and an hour there. Slow and steady. I started the week prior to Christmas and finished most of it while I was on vacation with family.
Creating the Mom Viz and Template
I had a few ideas of things I wanted to capture in the viz that I thought would be both easy data to obtain and vary from person to person. These were:
- Age and significant life events
- Typical things responsible for thinking about
- Daily activities
- Number of children and their age and gender
- Hobbies (past and present)
Additionally, I wanted to use various chart types and similar creative methods to paint a landscape.
Years Around the Sun
This was the first chart I started with and also the last that I ended up needing to fix to allow it to be flexible. I started with a fully custom polygon that I created using Interworks Drawing Tool for Tableau. I originally wanted the polygon sun, but didn’t know at the time I’d use it for age. After I created the sun for my 36 years, I realized it wasn’t going to be flexible for others, so after I finished the rest of the viz, I created a simple radial bar chart that would adjust based on age. The center of the polygon I left for 10 key moments that can be customizable.
Creating the data template for this was extremely simple. It’s just two rows for every year – one for path=0 and one for path=1. You basically enter in all the years you have been alive and duplicate the records, entering 0 for path for the first set and 1 for the second. The calculations are pretty straight forward and you can find them on my post about radial charts. I made some modifications, but you can download the workbook to check it out!

Mental Mountains
Going with the polygon theme, I created a few mountains using the same Interworks tools as I used for the sun. I created one mountain then in Excel I played around evenly shrinking the values in order to get smaller polygon shapes.

Floating Through the Day
When I started to put together the daily activities, I started with 30 minute increments to list out everything I did on a typical day and how my time was divided up. However, aside from sleeping and work, other activities were very small in regards to length of time. I decided to group these items in order to create clouds. Since I didn’t want my clouds to be symmetrical, one side is the actual hours and the other is doubled. The lengths are still comparable, and it looks better in my opinion.
But after sharing this with some other moms for feedback, I realized that I wanted to still be able to see each individual point in time that a mom had an activity. In order to do this, I create some rain drops below the cloud in order of the time of day on the X axis and randomly plotted on the Y axis.

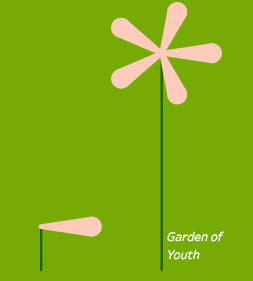
Garden of Youth and Hobby Poppies
The flowers for children is probably my favorite part. It also was the third piece I created because the whole point came down to people who had families and how so much time goes into caring for children and spending time with them, that there is little left over for personal hobbies during normal waking hours.
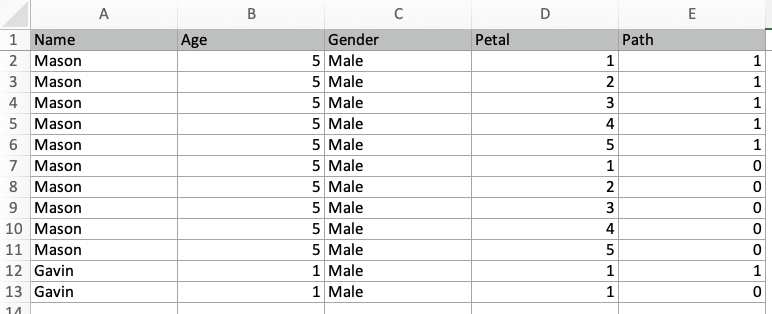
The flowers were simple to set up in Excel as it was just like the sun burst. I have twice as many rows as my child is old: one row for every year for path=0 and path=1. You can see below and my oldest, Mason, is 5 years old. So I have 5 rows, one for each petal, for each of the two paths. Gavin, on the other hand, gets one petal and two rows for that one petal.
Making this all work as I wanted in Tableau took me a little time. The flower part was easy, but getting the flower to also sit at the same height as the child’s age took me a little time and playing around to get it just right. Remember, I needed to make this dynamic for anyone who was putting in their own data. Eventually I got it right!
The hobby poppies were simply a bar chart and a shape on time indicating the number of years ago a hobby was started. Details in the tooltip explain how long it has been since I did the hobby and if I wish I had more time for it. Those in purple are ones that are not currently active.
Sharing with Others
Lastly, I wanted to share this viz with other moms and provide them the data template to upload their own information. I had a friend of mine test it out to ensure that when her data was entered the viz would update accordingly. I saved the Excel file to my Google Drive here. Below are a few of the vizzes from the community! Aren’t they beautiful?!?
If you want to create your own all you need to do is download the data and replace my data with your own. Then download the workbook and replace the data with your own data! Then feel free to share on Twitter and tag me so I can see it!
To all the moms, dads, husbands, wives, families, or whomever you are, you each are beautiful. I hope that this visualization provides an opportunity for people to visualize a part of their life quickly and simply. This is for those people who just don’t have lots of extra time and I hope by sharing this others can feel the satisfaction of creating something unique without all the leg work! It’s all about supporting one another!
")
")

Final Disclaimer
While I originally created this viz to support other moms who I had connected with, in no way am I implying that dads don’t struggle with the same issues of balancing family time and personal hobby time. We all struggle with the realities of being busy, passionate people. However, there are less women in the Tableau Community and in order to encourage and support one another, sometimes it’s important to lend a hand to specific group. There is clearly a connection I have with other mothers and women, so that was my intent. But by all means, dads or single people out there – feel free to make your own landscape and adjust as needed! Your “Garden of Youth” may be your dogs or cats, or other family that requires your time.
Remember what I listed at the beginning of this post:
- Reflect on your reactions. They are usually about you not the other person.
- Define clearly your goals and aspirations. Your goals shouldn’t be those of others and do not need to be of the same quantity, duration, or intensity. They are yours.
- Reevaluate time. All the choices you make require time and it’s only up to you how you structure that.
- Connect and support others. Both those who are similar and those who are different.
It was helpful for me to go through this list and it has changed my perspective about my hobbies and my time going forward.
Lastly, I’m encouraging anyone to use this template and viz if you want to visualize your day. The more the merrier! Love you all.
Cheers,
Lindsay


9 comments