

December marks eight months since I started #ProjectHealthViz back in May of 2018 and, therefore, it is the eighth, and last, data set for the year. The data was a large table that contained the number of births for each day of the year from 1994-2014 in the US and was obtained from the Social Security Administration.
It seemed like a simple data set: only 6 columns despite over 7,000 rows. In fact, it was really just a date and the number of births. Yet, simple data sets don’t always have simple stories or simple results. Many folks who participated this month shared a similar experience to mine. That was, I struggled with how to manage all the date data. How did I want to aggregate it? Perhaps by months, maybe exact days, or maybe days of the week? What story was I going to tell? What story did the data tell me? How did I want to graph it?
Sounds simple enough. And it’s true, sometimes visualizations come quickly and without hesitation. Other times, the process of developing a dashboard (regardless of the complexity of the data or the charts used) can be laborious.
Let’s review what I learned from this month’s #ProjectHealthViz.
The Data Won’t Be Mad if it’s Not Used
Upon first glance, when the US birth data is aggregated by year you get a simple line that isn’t too interesting (slight rise in 2008, but then a decline). Even by month, you can see that summer months have higher births, but again, what is the story? And by exact date (using dots) you can see there is a clear difference between some types of days (spoiler – the weekends that have fewer births) as well as some other days that don’t follow the typical trend.
For community projects, I’ve always struggled with being “okay” with not using all the data. At work, we are often tasked with showing all the data or certainly using it all so that people can gain all the insights available. It’s still a lesson for me to practice: How to parse out pieces of the data that tell a compelling story.
For example, Jeff Kritzman created a simple line chart that shows the annual percent change in conceptions (changed births to estimated conception to show when people are “deciding” to have children) compared to the Gross Domestic Product (GDP), which is an indicator of how economically secure the country is.
The story here was so compelling. While people may not have been thinking exactly about GDP when they decide to embark on the train of parenthood, when the economy isn’t performing well, people often decide to wait on having kids. Those with kids know that kids are expensive! Oh, how ironic, that is the title of Jeff’s viz. 😉
Key take away #1: Don’t over think it. You don’t have to use all of the data and aggregating can be your friend. Don’t worry, the data you didn’t focus on won’t be mad at you.

In the end, I used every data point. I got lost, to some degree, in the details. In the end, I did want to focus on particular days and the overall “feel” of births. Meaning, each point was a day, a birthday, a collection of unique events. I thought it was interesting that there were more births on days with the same day/month/year number, such as May 5, 2005 or September 9, 2009. One way to show that, was to show exact days.
Below on the left is what I like to call “a hot mess.” It’s a technical term, of course. On the right, is another attempt I had made at showing a story. The reality is that I struggled a lot figuring out what I wanted to do with this data. In the end, it just took a long time to find something I was happy with.


Simple Charts Can Be Beautiful
I realize people use community projects for various reasons or goals. Some people use them to enhance their skills. Those skills could be learning how to analyze a data set that is base on unfamiliar content. Other skills could be to try new advanced calculations, formatting techniques, or chart types. Other people use them to try out a new design, maybe a more playful dashboard than they are able to do at work. Whatever the reason, do it for you, not because someone else did or to impress anyone – unless that person you are impressing is yourself!
I admit, I do enjoy seeing the variation and creativity people bring to these projects. However, with that wide audience, I think it can also be overwhelming to think that you have to create something magical or new or even complicated, for that matter.
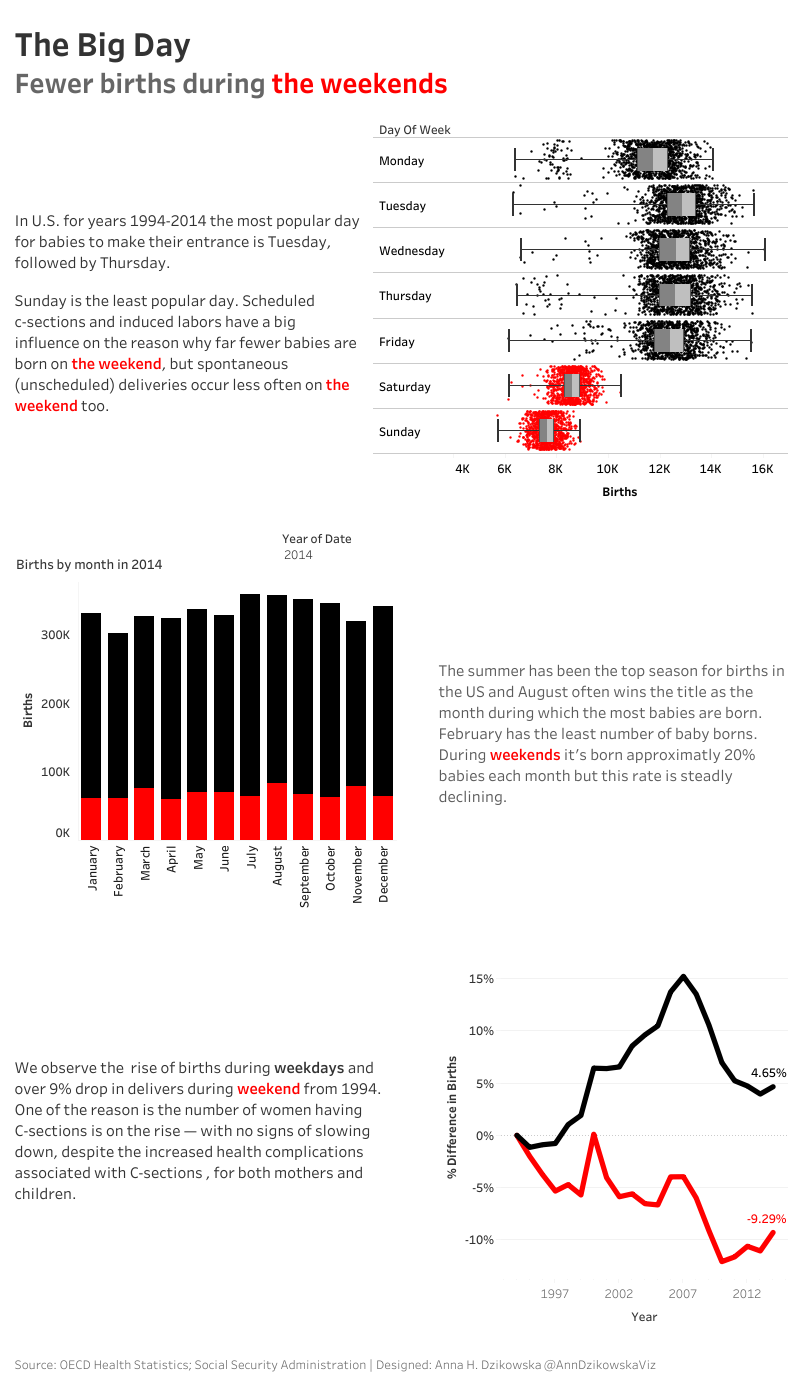
Anna Dzikowska created three simple charts: a box and whisker with the underlying details, a bar chart, and a line graph – all threaded together with text to complete the story. She focused on the wide difference between weekday and weekend births and used three methods to call out those details.
Key takeaway #2: Simple can be beautiful. Simple is powerful. If you find yourself overwhelmed with “finding” a creative chart for the data, STOP. Take a few steps back and rethink your motivation. Does the data, or the story, really need that? Do you really need to do it?
Originally, I wanted to use this data set to try out a joy plot. I knew the data may not have been the best for that since there were seasonal trends and in general some regularity to births. However, I thought maybe if I did it by month, or year, I would be able to see those interesting spikes that I discovered when using all of the data points.
Despite failing miserably at the joy plot, I still continued to play around with calculations and chart ideas. I don’t know why I felt it needed to be complicated. It didn’t! If you are like me, then every now and again you feel the pressure to make something original, or fancy, shall we say. Well, I learned here that that idea is just bullshit. Fancy does not equal good, or compelling, or accurate, or breathtaking. Sometime complex or fancy charts don’t convey the data in a meaningful way or they are confusing, or they just look silly.


Phone a Friend
One thing about the Tableau Community that I love is that they are always willing to lend a hand. Additionally, you can have access to people all around the world with various perspectives and knowledge. During this month’s project, I reached out to a few people, but only to complain about my struggles. I should have considered asking people what they thought about what I was working on and perhaps give me some ideas to “reign me back in” from my crazy spiral.
Pamela Germain posted a question to the community regarding how to possibly make a radial chart for this data set after seeing some inspiration from The Insider. She asked “Hey #datafam, for #projecthealthviz I was inspired by this visualization that used the rings of a tree to show change over time. My skills are lacking, even with several How-Tos I found on radial charts. Was curious if its possible in Tableau.” Upon seeing this, I tagged a few folks on Twitter to see if as a group we could help Pamela out.
Unsurprisingly, many willingly took time to solve her question. In fact, Ken Flerlage actually not only solved the question, but went all the way as to compete a visualization for the US Birth data set.
Key takeaway #3: Don’t be shy to reach out, individually or in masse, for help, ideas, or feedback when you are stuck. There are many ways to connect with others and you can find what works the best for you. What I am confident in, is that folks in the Tableau Community are eager to help and support one another. So I’d encourage you not to be shy if you want or need support.

Business Dashboards CAN Be Interesting
If you don’t already know, you should become familiar with Andy Kriebel’s amazing business-like KPI dashboards. He has used them in many #MakeoverMonday visualizations. I find them crisp and effective. Here is one he did on avocado prices, for example.
Kevin Flerlage messaged me while working on his visualization for December and expressed, similar to my own feelings, that he was struggling with how to visualize the data. In the end, he took a “business-like” approach. I think it’s actually helpful now and again to challenge yourself to try to take non-business data and try to make it into that sort of dashboard. In part, this data may be someone’s business data, but also, it helps you clean up some of your practices and concepts that you may actually use at work. Kevin’s viz used a small multiples/trellis chart to visualize each year’s trends along with the high and the low months. Additionally, as in typical Kevin style, he added in a button to switch the whole view from births to conceptions, adding in a little extra for the user to explore.
Key takeaway #4: As Simon Beaumont has said, business dashboards don’t have to be boring and KPI-like dashboards can also be inviting and engaging.

Clearly, my advice is all in retrospect. I didn’t do any of the things I’m suggesting you consider. Hindsight is 20/20 but now I have some key concepts to remember for my next viz. In the end, my visualization used all of the data. I focused on the story about some outlier days and some general trends. Because I was so far down the rabbit hole, parts of my “hot mess” still ended up in the final viz. It was an interesting process and, as usual, one that resulted in a lot of learning!

Thanks to everyone who shared their US Births visualization this month! They were all so interesting and different. I was thrilled with the participation.
Remember if you want to get involved, check out my page on #ProjectHealthViz.
Cheers,
Lindsay
