

Barbell charts, also known as dumbbell or DNA charts, are an effective visual to show the difference, or change between two data points. I personally love how this chart shows both the actual values of the data points along with a visual indication of the difference, in length, by connecting the two data points together.
Typically barbell charts utilize two mark types on a dual axis: a line and two points, often a shape of a circle. However, using lines and points together on a dual axis can open up a number of alternatives for this chart type.
This Monday Mini will show you how to build the barbell chart and then show a few useful alternatives for “the real world”. To check out the full Tableau workbook, you can go view and/or download it here.
To start, using Tableau’s Superstore data set, we want to create our base line which connects the two measures together. We could connect Sales and Profit (two measures already available), or the most recent month sales to last month sales, or the first year’s sales to the last year’s sales (the latter two being measures not created yet). Let’s create two measure in order to compare sales from 2016 to 2019.
Since our data source doesn’t have two measures to separate out the years, we need to create them. In order to do that, we will create two boolean calculations, “2016 Sales” and “2019 Sales”, each will only return sales values if the year matches the year we identify.
2016 Sales: IF YEAR([Order Date])=2016 THEN [Sales] END
2019 Sales: IF YEAR([Order Date])=2019 THEN [Sales] END
Now that we have our two measures, we need a dimension for our view. For this example, we will use “Sub-Category.
Creating the barbell chart takes 4 general steps. Let’s go through them.
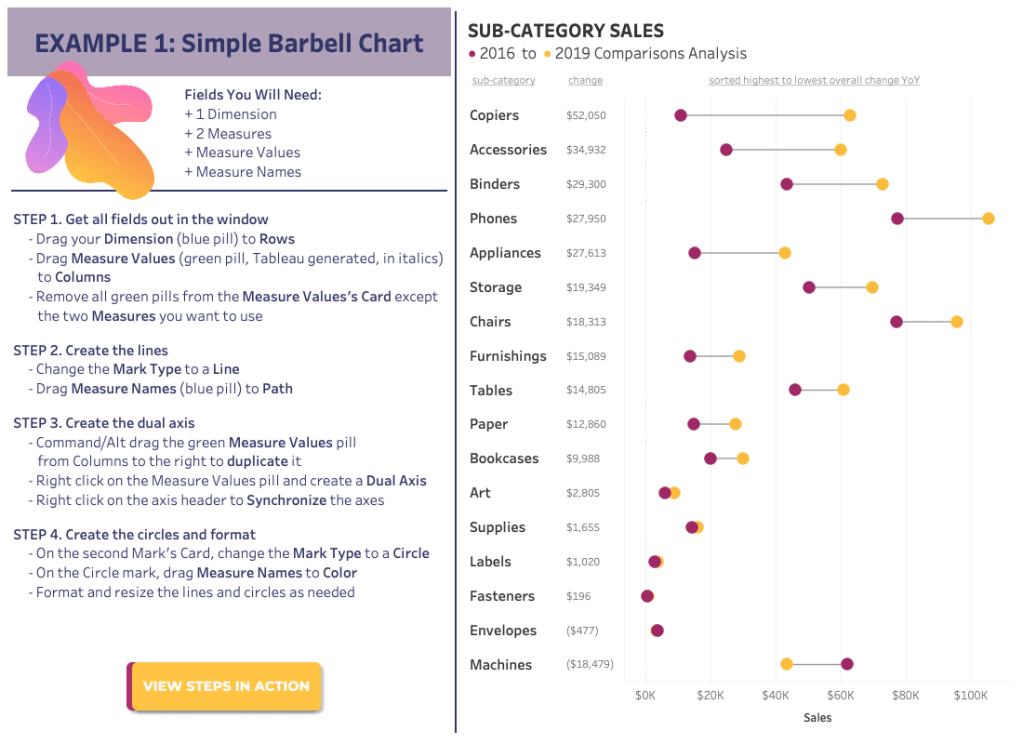
STEP 1. Get all fields out in the window
- Drag your Dimension (blue pill) to Rows (we are using Sub-Category)
- Drag Measure Values (green pill, Tableau generated, in italics) to Columns
- Remove all green pills from the Measure Values’s Card except the two Measures you want to use (We only want 2016 Sales and 2019 Sales)
STEP 2. Create the lines
- Change the Mark Type to a Line
- Drag Measure Names (blue pill) to Path
STEP 3. Create the dual axis
- Command/Alt drag the green Measure Values pill from Columns to the right to duplicate it
- Right click on the Measure Values pill and create a Dual Axis
- Right click on the axis header to Synchronize the axes
STEP 4. Create the circles and format
- On the second Mark’s Card, change the Mark Type to a Circle
- On the Circle mark, drag Measure Names to Color
- Format and resize the lines and circles as needed
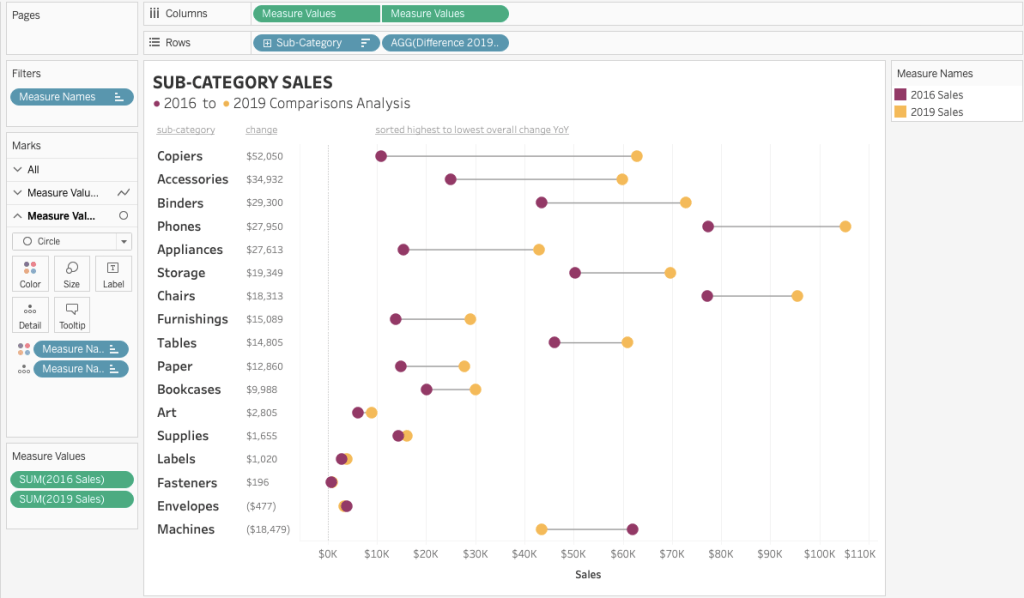
You final view should look something like this:
There are many additional ways to use the concepts from a barbell chart. You can add reference lines to show the average between to points, you can change the shapes to show direction using arrows, you can adjust the thickness of the line to make it appears as an enclosed pill shape with circles at the end, and you can even label the circles if you have enough room.
In a Dreamworks Animation viz I did, uses an example of using the connected measure line and a shape for the average.
Here is an example where I connected the low/high via the line and plotted all the years for the same day of births as the shape/circle.
In a viz I did on the Human Development Index, I used a barbell chart to show the min/max countries for a variety of measures. Connecting the min/max showed how large of a difference countries were on the HDI.
As always, check out the full viz for more information and how to reverse engineer it. I hoped you enjoyed this first Monday Mini tutorial!
Reach out if you have questions!
Cheers,
Lindsay

Wow! I did it! Thanks Lindsay
LikeLiked by 1 person