

Working Together
I vividly remember sitting at a table with my peers in and being assigned to work with another classmate on a project. While I loved projects and I loved school, I wasn’t sure at the time how I felt about working with others on something that I would eventually be graded on. What if they didn’t pull their weight? What if I didn’t like their contributions, or worse, straight out disagreed? How would we coordinate meeting up to discuss the project? Who’s house would we meet at? Do I even like this person? Do we get along? What if I got a bad grade because of their lack of effort? Or what it was because of their effort?

The questions would flood my mind. Working with someone collaboratively, not just side by side, took some time and practice to navigate as a young child. First, and foremost, it taught me (and likely others) how to navigate planning and outlining a project, determining roles and strengths, managing challenging conversations, and weaving together perhaps two distinct people’s input and creativity into one cohesive final project.
Tableau Collaborations
One year ago (can I just say, holy hell how time flies!), in February 2019, I noticed two visualizations that were designed each by two individuals. Klaus Schulte and Ludovic Tavernier completed a visualization about the tennis star Boris Becker called Game, Set & Match: Becker. This achieved the Tableau Viz of the Day (#VOTD) on January 4, 2019. About a month later, another collaborative VOTD was given to Spencer Baucke and Chantilly Jaggernauth on February 13, 2019 for their viz called The Great Migration.


I follow all four of these amazing individuals on Tableau Public, so I was aware of the visualizations before they were spotted in Tableau’s Gallery. However, it got me thinking about the process. These were great visualizations and clearly there must have been some method and thought to the collaboration to make it successful. Since I hadn’t seen any other Tableau visual collaboration on Tableau Public prior to this, I decided the best thing would be to try it out myself and document the process so that others interested in working on a visualization with another person could have some steps to consider.
In February 2019, I asked my friend Kevin Flerlage casually about the idea of collaborating. You can actually listen to a presentation we did at Tableau Conference 2019 about our viz here. In that presentation, we share how we messaged each other about collaborative, agreed on a topic, searched for data, and went back and forth to create what would become one of my favorite vizzes (and a Tableau Public Viz of the Day).
This blog post is meant to provide some suggestions and recommendations about how to go about working on a collaborative visualization with someone else. I’ve listed out 8 steps that worked for me and hopefully will give you some framework to think about how to start this fantastically fun adventure!
Step #1: Matching Up
Finding your partner
Data visualization, especially in the creative public space, can often be quite personal. This means that many of us put a lot of time and effort into our visualizations. We feel passionate about our decisions and perhaps even emotionally connected to the data and the emotions the visual story evokes. In fact, sometimes when hold so tight to what we have created that even when given very good (and accurate) feedback, we struggle to make the changes.
This brings us to Step #1 – Ask someone to viz with you
Because of this personal aspect, I think it’s important to collaborate with someone whom you respect personally (on a friendly level) and professionally (on a visualization level). Your partner should be someone who will bring what you are looking for to the collaboration. This could be any of the following elements:
- Fun and enjoyment – someone who will be lighthearted and enjoyable to banter back and forth with
- Technical expertise – someone who will fill in the gaps with knowledge that you need to bring your ideas over the finish line
- Design eye – someone who has a visual design different than your own, but one you wish to implement in your visualization
- Yin and Yang – someone who is quite opposite from you in many ways, perhaps both visually and personally (geographically, ethnically, gender, etc) but will ultimately teach you a ton about collaborating
- Topic knowledge – someone who knows a shit-ton about the data or topic you want to visualize (such as the sports nut who knows everything about baseball or that guy who can tell you the names of every Kakapo in the world – I mean hypothetically speaking)
So go ask that person you’d like to collaborate with if they are interested. Be prepared to discuss timelines, topics, expectations, and all of the subsequent steps below. Choose wisely!
Community Comments
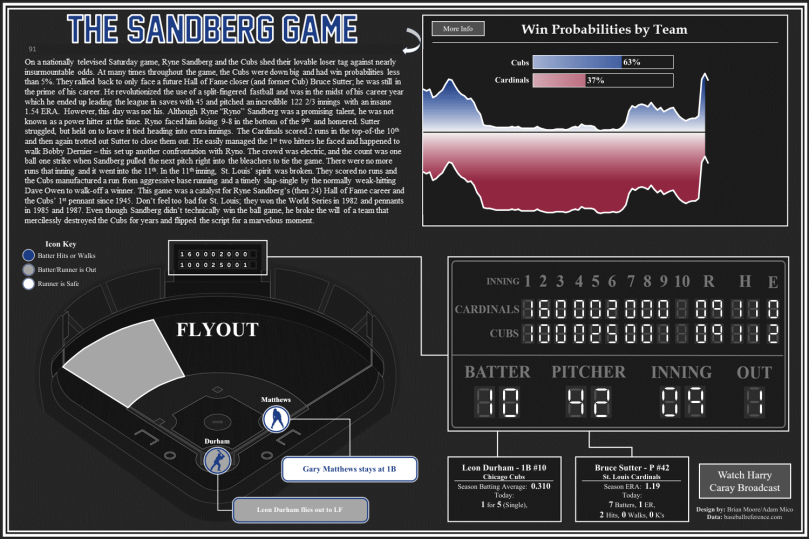
Adam Mico and Brian Moore did a fantastic collaborative viz on The Sandberg Game (baseball). Adam told me that he reached out to Brian to collaborate because he was a fan of Brian’s work and he “had the data set [he] was holding on to, but knew it needed to be collabed to get it to its next level.” You can read more about their collaborative process here.
Step #2: What to Viz
Choosing a topic
Choosing a topic can be one of the easiest or most challenging steps in a collaboration. If you are going into the collaboration already with a topic and dataset in hand, then you’ve already mentioned this when you asked your vizzing partner-to-be. However, it’s not a requirement to have the data or topic defined before you ask someone to collaborate.
When I causally discussed the idea of a collaboration with Kevin, I didn’t have a topic in mind. Not even a hint of one. However, our initial discussion was quite quick. We were lucky that it only took one suggestion for us to agree on a topic and thankfully that topic had legs to stand on and data to support it.
If you have a topic already in mind, then I’d suggest doing a bit of research before reaching out to someone to collaborate. Make sure there is data to back your idea. This will also help you identify if there is going to be a “data clean up” step in your process and who will be the one doing it. If you already have data ready to go, lucky you! Then just find the person who will match up to bring that data to life.
If you don’t have an idea, then consider step #1 again. Your partner will need to be someone open to the same topic. For example, when Kevin and I agreed to collaborate, my first comment was “no sports” because I did not want to do a sports viz and he had been on a sports kick at the time. Thankfully, he was totally open to other ideas.
Be prepared for some back and forth. When I collaborated with Sarah Bartlett in January 2020 to combine her #IronQuest and my #ProjectHealthViz initiatives we went back and forth a bit to come up with a topic that would suit both projects. This meant looking for data and refining ideas based on what was available and what would be interesting.
Community Comments
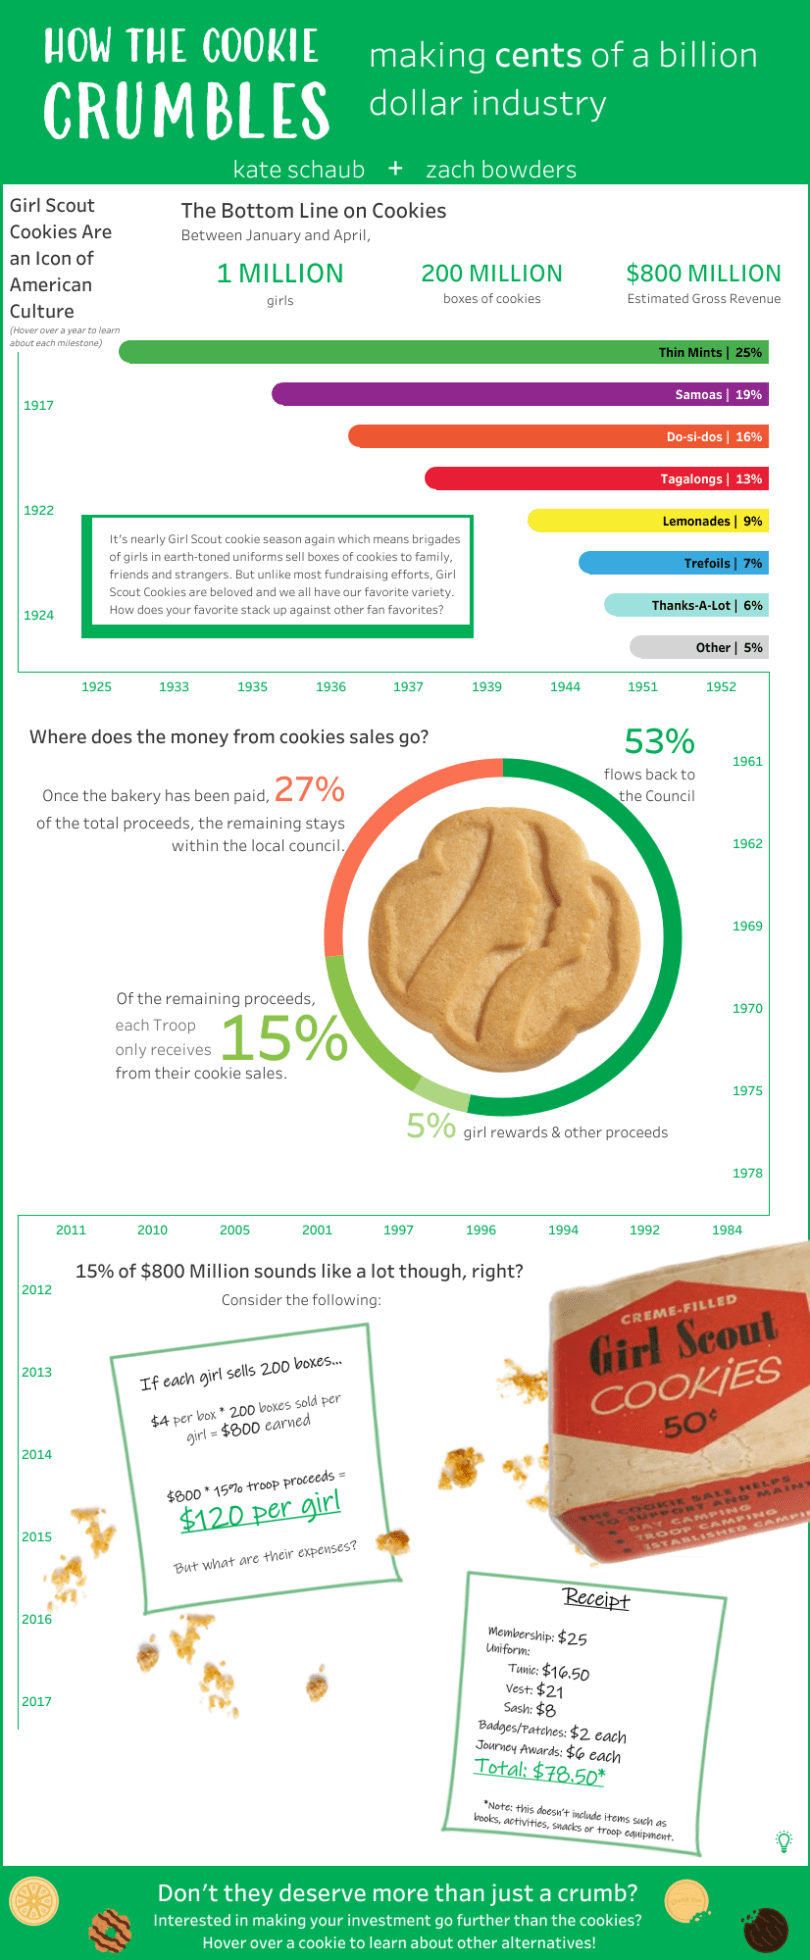
Zach Bowders and Kate Schaub worked on a collaborative viz on Girl Scout cookies (check it out here). Zach mentioned that he had been curious about Girl Scout cookie sales revenue for some time and he saw “everyone hustling to sell them,” but also saw friends with kids in the Scouts still paying for quite a number to increase sales. Zach mentioned to me, “I wanted to know more about how much more money there was and where it was going.” So their idea stemmed from a question, a curiosity, that one individual had. He reached out to Kate to collaborate as it was a goal of his to make something a bit outside of his normal comfort zone.
Riddhi Thakkar and Saujanya Ram also worked on a viz together. Unlike Adam and Brian, they chose to work on a community project together which already had data ready for them to use. Riddhi told me that she was pretty new to the Tableau community when Saujanya approached her to collaborate on a #ProjectHealthViz. She said, “I had been following her work and didn’t hesitate to say a ‘Yes’ to start off with the project. We both had been participating in #projecthealthviz and decided to use this platform to collaborate and have fun.” Check out their viz on measles here.

Step #3: Timeline and Chit Chat
Timeline and communication
Don’t underestimate Step #3. We are all very busy people and being clear on a timeline and reasonable expectations is important. You don’t want to go into a collaboration expecting to have a completed viz in 3 weeks when your partner doesn’t have a lot of time to offer and more realistically can’t get it done for 3 months.
It’s better to be upfront about your goals and the time you each can dedicate to the project. Consider people’s work schedules, family constraints, and vacations. But make a goal. It’s better to collectively determine a target date and aim for it, than to just say “we will get it done.” Holding each other to the target can be beneficial.
Kevin and I got on a phone call at the end of the first week. We gave ourselves some time to think about the story, find some data and inspiration, and consider the goal of our viz. Once we both had ideas, we were able to chat about the plan, who would do what and in what order, and next steps. We gave ourselves a loose timeline of one month. We knew we already missed any “key” dates for an endangered animal viz, but realistically knew that we both had some time to focus on this viz. Neither of us had other pressing Tableau Public projects so we both were able to make the commitment.
One thing was clear, we were going to keep in touch via messages and then have another call in a week or so to check in and discuss any touch points we needed to resolve/agree upon together.
Regular communication can vastly improve your interest and dedication to the project. The more you and your partner talk about ideas, share sketches, provide inspiration and data to each other, the more you will keep the momentum going and get to that finish line.
I recommend setting up a phone call (or WhatsApp chat, Zoom, Google Hangouts, etc) within the first week of identifying a topic. This will give you and your partner a chance to verbally discuss your goals, the plans for data collection, how you will share the workbook, who will do what (assigning roles), and get your super excited for this wonderfully rewarding journey you are about to embark on together!
Community Comments
Adam shared that he and Brian “communicated quite a bit; many DMs and screen shots back and forth.” In fact, they even started with some “sketching”. Adam told me, “For wireframing, we each did our mock-up in PowerPoint. We worked off each other’s workbooks – it kind of went back and forth, but he was mostly responsible for the complex math that was required for the viz.”
Step #4: Sharing is Caring
Sharing files
Today it’s pretty easy to share many files (such as Word documents, Excel files, images, etc.) through programs/apps like DropBox, Google Drive, and OneDrive. Tableau Workbooks, unfortunately, aren’t as easy to share.
My recommendation is start by creating some sort of sandbox where ideas, data sets, links, and inspiration can be stored and shared between each other. Google Drive is a great place to do that. Once you move beyond the creative and exploratory phase of your dashboard design and into the building phase, this will be a great place to organize thoughts.
Next, once you get your data sets, someone should pull them all into Tableau and get the data sets structured (or joined, blended, pivoted, whatever) in the way you will need them. It’s much easier (though I know it doesn’t always work this way) to have all the data in the workbook before it goes back and forth for work.
Kevin and I created a packaged workbook and emailed it back and forth for the duration of our collaboration together. Typically, only one person was working on it at a time and if the other person had an idea, then the workbook would be emailed back. We did, at one point, have some versioning issues and almost lost the most updated version. Best advice, only one person work in it physically at a time. If you both want to work through ideas, the best course would be a video screen share where ideas and work can happen together in one place.
Community Comments
Riddhi and Saujanya initially started working in separate workbooks and shared ideas regarding lay and possible charts via images. Riddhi explained, “Later we divided these charts among ourselves, started creating and, in the end, one of us combined both the files and shared it with other for feedback and other final touches.”
Another alternative to sharing a workbook via email is to use Tableau Public. By keeping your viz hidden others won’t see it, but you are still able to share the link. This allows two people to view and download the workbook. Essentially, republishing it for download by the other person.
According to Zach, “It began with my workbook which I published. Kate downloaded it, made changes, published it to her site, which I then downloaded, etc. We did a lot of iterations, and the top 2/3 solidified very quickly but we struggled to get the last third to a place where we were happy with it. When both parties are good humored and on the same page it really takes some of the issues of “ownership” out of the equation.”
Step 5: Go Forth and Find Data
Research and data collection
As with most visualizations we build, we need to do a bit of research. This may mean searching for data, researching the topic and finding a story, or even researching your audience. I think this step is pretty self-explanatory. I mean, you are a data visualizer or analyst and likely use and look for data all the time. However, as I mentioned earlier, it’s best to put all the data and links in one shared place. This way, when you are ready to start your viz together, you both can review the data and ensure that the data matches up and hangs together in one story (assuming you are using more than one data source).
After Kevin and I came up with our idea, I did most of the data searching. I grabbed links to all the sources and possible data sets I could find and put them into a Google Doc. This was so that we could get a sense of all that was out there. Remember, we didn’t necessarily have a story yet – we needed the data to provide that. After finding more than a dozen links to decent data sets, I started to comb through them and bring them into Tableau to see what would work and what wouldn’t. Then Kevin and I discussed what data we had and what stories were possible, plus what additional specific data we still needed to find to make the story really clear.
If you approach your partner already with a data set in hand, or are using a curated data set from a project such as #MakeoverMonday, #ProjectHealthViz, or the new #SDGVizProject, then this step likely will be skipped and you can go straight into deciding how you will visualize the data that you have.
Step #6: Collaborate Visually
Collaborate on visual elements
This is probably the step that takes the most time, especially because it is where two styles need to coalesse and discussion often occurs about what types of charts to use, what layout is best, and how to make a story flow.
Generally, I recommend playing on each other’s strengths. When Kevin and I collaborated, he initially provided me a recommended title and image. I had another vision in mind for the top portion of the visual. We went back and forth for a while disagreeing and trying to come to a consensus on a font and image. In the end, I realized that coming up with clever titles and fantastic images was really one of Kevin’s strengths in all of his vizzes. Once I was able to see that he was really good in that area, I totally trusted his recommendation.
As far as charts and other visual elements, I think it’s a great idea for both parties to put together some ideas and float them back and forth to each other. This will get creative juices flowing. It’s good to take the data and each play with ideas, putting them in a dashboard, or even just sketching them out. I originally did some sketching to get a layout idea and shared that with Kevin. He started with some ideas of chart types, which we were able to discuss and improve upon together. Then we could start to put the charts into the proposed layout. Ideas started to flow from there as we passed the workbook back and forth.
In the end, trust your partner and communicate as much as possible as you are going through the process. Don’t be shy to mention that you don’t think something works well or that you have different ideas. The whole point is to collaborate and make decisions together – oh and to enjoy yourself!
Community Comments
Regarding the collaboration with Adam, Brian shared that, “The design was probably the hardest part. We were both in full agreement on the different elements that should be included, but coming up with the final design took a lot of back and forth…and we hit a few hurdles along the way.”
Similar to Adam and Brian, Zach and Kate also shared ideas by sketching, drawing on current versions to make comments, and direct messages to discuss ideas. Zach told me, “We’d talk in Twitter DMs a lot, sometimes send hand drawn ideas, circled portions of existing versions, etc.”
Step # 7: I’m Getting Some Feedback
Determine the feedback process
Feedback can sometimes be tricky. Josh Smith has a fantastic blog post about how to give feedback. Depending on who your partner is (close friend, new friend, someone you haven’t interacted with much) will determine how you approach feedback. Josh cautions that it’s not overly helpful to say “do this, don’t do this” or “let’s scrap this” and “I’m not a fan of this”. A better, and more helpful approach is to phrase these into question to allow your partner to explain their rationale. By doing this, it also puts the other person in a position to actually reflect on their choice and perhaps defend why they made the choice they did.
Josh says, “Directive feedback usually comes from a helpful place, often well-grounded in data visualization theory and best practices. However, directives fail to take into account the creator’s design strategy: why did the creator choose to do things a certain way? Our data visualization works deliver not just information and insights, but an experience. That experience might be purely informative, but many times we’re designing for something more.”
In my case, Kevin and I were friends and because we had spend a lot of time chatting over the course of a year, and hangin out at the conference, I think we both felt comfortable being pretty direct with our feedback. However, that didn’t mean we didn’t have disagreements. We did. What I recommend, is to actually talk if possible during these discussions. I find that it’s very helpful to have these conversations when you can hear someone else’s voice. You can spend some time to hash out details, discuss ideas, bring back old ones, and figure out really how to solve the disagreement. Perhaps old school, but sometimes that is much harder over email or messages.
Bottom line is that it’s a collaboration and there could be parts of the viz that you or your partner may have to just say, “you know what, I trust you here.” Or “this seems really important to you, so let’s keep it in.” In the end, as everything comes together, you both may go back and realize you really aren’t so attached to that one thing as you thought you were in the moment.
Fred and Frederick (whom I mention more below in the next section) shared that they had 11 versions of their visualization. Kevin and I also went through many iterations (probably more than 11!). So by the time you get to the last few, you really have an opportunity to look back and reevaluate all your prior choices. Again – collaboration and have fun and use the opportunity to learn from your partner.
Community Comments
Zach shared with me that they never really had any conflicts during the feedback and iteration phase. He said that neither of them felt like it was their personal viz “but more as a shared effort and really wanting each others best ideas to shine.” Kate echoed his sentiments stating, “During the feedback process, there was discussion throughout about what was working and what didn’t or wasn’t working, so I personally didn’t feel like I had to make any concessions on my end.”
Step #8: Publish and Share Your Work
Agree upon publishing details
The last and final step is to decide how you want to share your work with others. If you are posting to Tableau Public, it’s important to decide if both parties will publish the viz and note it is a collaboration, or only one person. I’m a fan of both people sharing the collaborative work. I think each should be able to take credit for the amazing work and be able to share it in your portfolio.
However, it’s worth noting that page hits and favorites will not attribute to both version of the viz. Same with a Viz of the Day – only one version can be linked to the Gallery. While not a big deal, it is worth being aware of when you decide how to share your work together.
Lastly, decide if you are going to share on social networks at the same time or whenever you want. Depending on your separate networks this may or may not matter. I know that for Kevin and I, we were very excited to share our visualization with everyone and planned to release it at the same time on Tableau Public (unhiding it), on Twitter, and on LinkedIn. Since we shared much of the same network, this allowed us to get it to the group at the same time. We called each other on the phone and then clicked the send button literally at the same time for our posts. Most of this was due to our joint excitement and desire to share in the final accomplishment of marking the viz collaboration as complete.
Community Comments
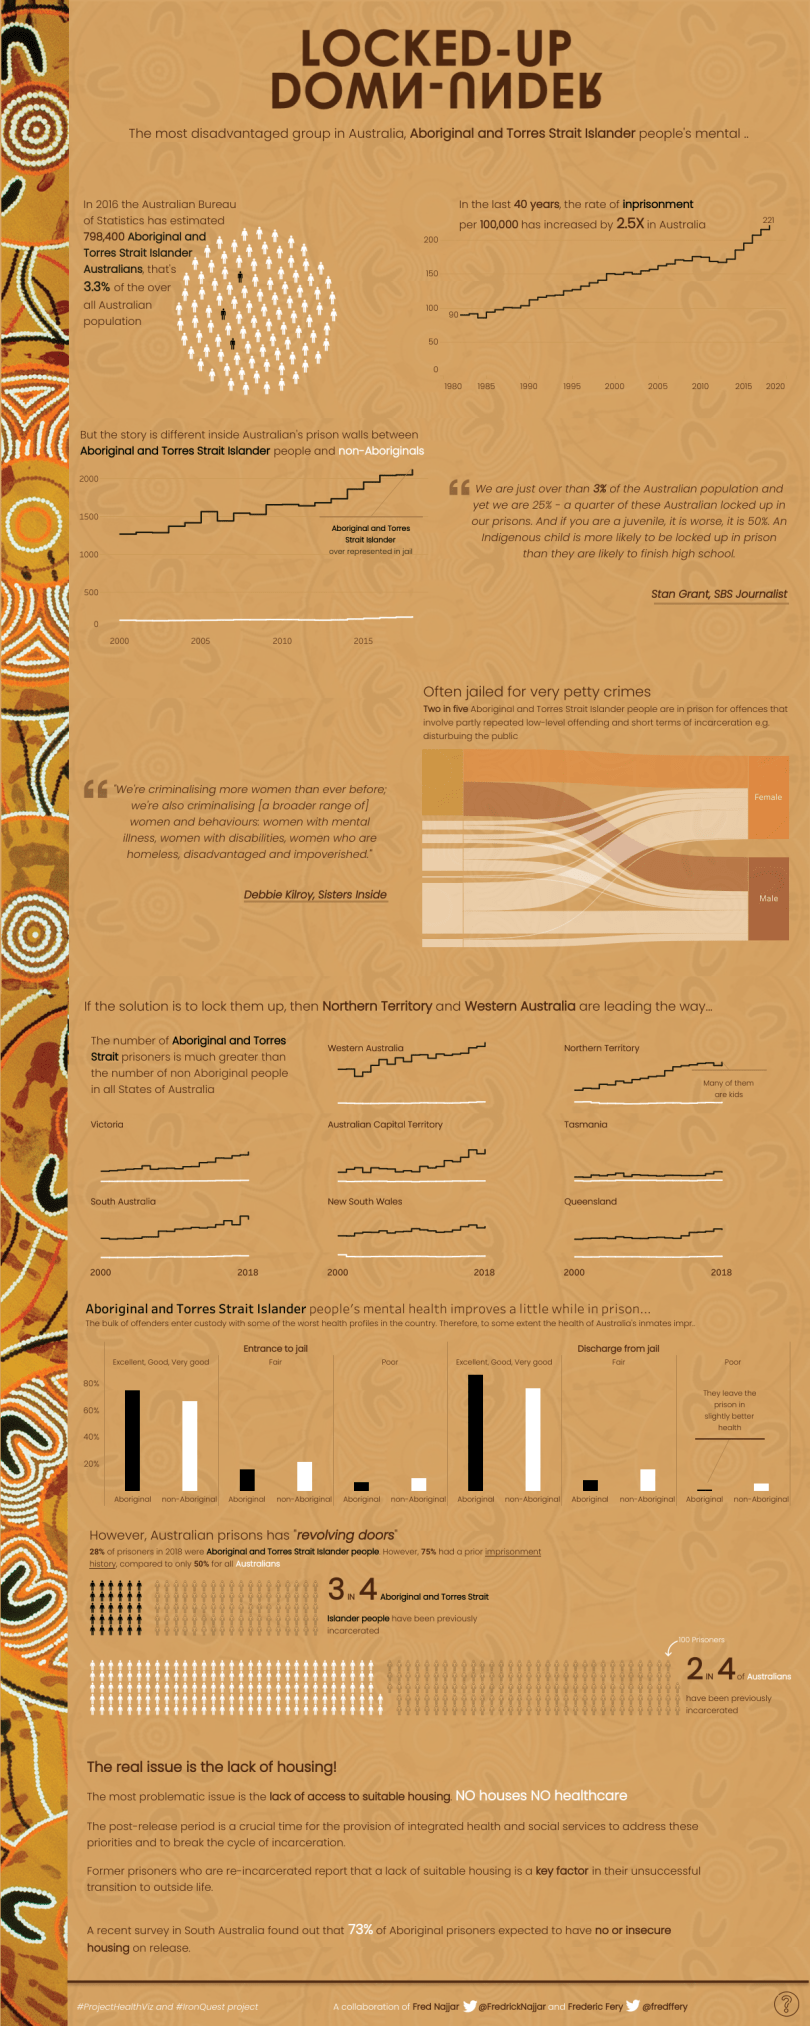
Fred Najjar @FredrickNajjar and Frederic Fery @Fredffery recently completed a viz together (you can read their blog about it here). They mentioned that one challenge was version control (which I mentioned earlier) and how to publish the work. Tableau doesn’t have a way to “share” a viz on both pages without them being separate and you can’t link the other person to it (other than the attribution/inspiration section).
Fren Najjar said, “We had a few hiccups when it came to version control and narrative.” Frederic Fery mentioned, “It is easy to do a live collaboration with a Word doc or Powerpoint file, not with tableau and multiple data sources – there is no shared environment, but if you come up with the process, toolbox it should be fine. Also, the publishing process is a bit tricky ie, who is publishing the viz? You don’t want to 2 authors to publish a duplicate? Maybe having a Co-Author option would solve this issue.”
Check out their collab viz which was an #IronQuest/#ProjectHealthViz collaboration!
Recap of the Steps to a Successful Collaboration
- Step #1 – Ask someone to viz with you
- Step #2 – Choose a topic
- Step #3 – Develop a timeline and communication methods
- Step #4 – Identify a method to share files
- Step #5 – Research and data collection
- Step #6 – Collaborate on visual elements
- Step #7 – Determine feedback process
- Step #8 – Agree upon publishing details
I hope all of this was helpful! I’ve continued to enjoy all of the collaborations I’ve seen in the past year. It’s inspiring to see so many Tableau users come together to visualize something together. Looking forward to seeing more in 2020!
Cheers,
Lindsay

Amazing!
LikeLike