

Tableau Conference
No matter what, the Tableau Conference is a spectacular event. The opportunities for learning and collaborating, networking and motivating, are practically endless. However, everyone comes with their own agenda and goals for the conference. Given my experience, I believe folks typically fall into one of three categories.
Typical TC Goal Categories
- To dive deep into learning. This includes attending as many hands-on sessions and Tableau-speaker sessions. Your goal is to learn the produce and take home tangible and useful new skills. Usually this is your goal for your first, and maybe even your second, conference. If you are attending on behalf of your company, you most certainly are there to learn and often bring back knowledge to relay to other Tableau users who weren’t able to attend.

- To strengthen your understanding of the functionality of Tableau and to crush your original idea that Tableau has boundaries, because it doesn’t seem to. Your goal is to listen in on talks by Zen Masters and sessions that spark creativity or challenge the status quo of how you previously had been using the software. You may check in with the Tableau Doctor and likely spend more time in the Data Village exploring the sites and chatting with vendors. If you are lucky, or just naturally willing to talk to anyone, you may spark some amazing conversations (perhaps in the new Braindates discussions Tableau started at TC18) with conference-goers.
- To connect with and find your “data fam” and to spend time conversing with others about inspiring uses for Tableau or community initiatives. Your goal is to connect with other data lovers and fuel future discussions after the conference. You likely will skip some sessions if it means you can spend an hour in thoughtful discussions with another Tableau user.
The Natural Progression
TC18 was my third Tableau Conference. I attended Vegas in 2015 as a Tableau newbie. I fell into the first category. I didn’t know what I was getting myself into, and I came to be a sponge. Soaking up as much knowledge as I could. My company sent me (they had never sent anyone before) and I felt obligated to return with as much information as possible that would benefit the others I worked with. While I spoke with two kind individuals during Data Night Out since I was wondering Fremont Street alone, I didn’t feel like I actually met anyone. But that was okay, I was there for goal number 1. Done and done!
TC16 in Austin was my second conference. There, I felt a little more comfortable and knowledgeable about what to expect. This helped my confidence a bit. I, as you may anticipate, came for goal number 2. I planned to attend a variety of sessions and hoped to expand the creative skills that I could use Tableau for. I met a few amazing people that I kept in touch with over the years. We were at a similar place regarding our use of Tableau and were involved in the community at the same level, which was barely.
Up until this point, my relationship with Tableau was strictly work-related. Yes, I had a few personal vizzes out on Tableau Public, but really Tableau and I were office buddies. We would connect in the morning, spend time together through the afternoon, and we would part ways at 5 o’clock. See ya!
Bottom line – I wandered a bit with my Tableau relationship for a few years before coming to a place where the path turned. As the saying goes, “Not all who wander are lost.” I definitely haven’t been lost. I think the slow progression into the Tableau Community has really helped me appreciate it so much more. I’m able to acknowledge that we all come to find our personal relationship with Tableau, and the people, at different paces, at different times in our lives, and for different reasons. The Community embraces everyone.
The Turning Point
I really loved Tableau even though we were only work friends. The funny thing was, I always wanted to viz at home. I had grand ideas, but just didn’t seem to find the time. All that seemed to change after I gave birth to my second son less than two months before the 2017 conference. I was out on maternity leave and my son took some decent naps during the day. I found myself with a few hours where I could practice Tableau on projects that weren’t related to work.

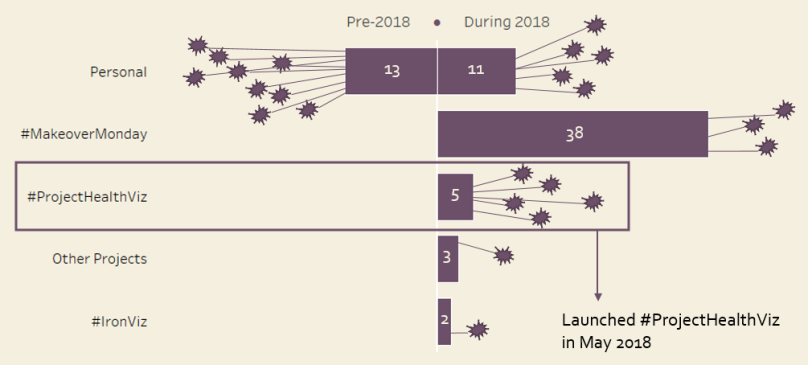
During Christmas break of 2017, I stumbled upon Makeover Monday, a weekly social data initiative currently run by Andy Kriebel and Eva Murray. It was also the time I realized that the Tableau Community “lived” on Twitter and if I wanted to get in touch with folks, I needed to bite the bullet and join in. So it was in Vermont, while pondering the snowy hillside of my parents’ cabin home, that I posted my first Makeover Monday submission and tweeted it out to the, probably, 0 followers I had at the time. It got a whopping THREE likes. But seriously, it was a big deal and aside from putting myself out there, I totally became hooked.
Venturing On
For the following 10 months, I spent a lot of time engaging with the Tableau Community. Most of that interaction was through Twitter, but also on Tableau Public (by liking vizzes and following others). It didn’t take long before I became immersed in the conversation. This meant that people reached out to me to provide feedback on my vizzes, to ask me questions, or to simply engage in some humorous data banter.
The conversations often went beyond just the Twitter feed, but into direct messages and thoughtful online discussions. Over time I learned, and engaged in, various other data projects such as the Story Telling with Data Challenge (#SWDChallenge), Throwback Thursday (#ThrowbackDataThursday), Workout Wednesday (#WorkoutWednesday), Sports Viz Sunday (#SportsVizSunday), and the National Day Project.
Finding Your Tribe
Your “tribe” is a group of people, or a community, with similar values or interests. A place you belong, where you are heard, and where you can make a difference. That sounds easy enough, but what isn’t as easy is the realization that whatever you do to find your tribe, do it your way and on your time. Find those few, or many, people that resonate with you, bring you joy, and spark your passion.
Your tribe is waiting. However, the trail to find it must be blazed by you and you alone. – Jeff Goins
While I certainly am not defined by my day-job, I do love the underlying data I work with. It’s about people. It’s healthcare. We all can relate to it and have experienced some segment of healthcare in our lives.
A few months into my Tableau Community journey, I reflected back on my path. I met some fabulous people who each had a huge community presence. Many of which wrote informative blogs or supported community data projects. I thought, “Could I do that? Do I have something valuable to share? Can I grow a healthcare ‘tribe’?”
I had always wanted to do more personal vizzes on healthcare. I thought that by being able to “test” out new skills publicly I may be able to create a portfolio of real examples that both I could reference for work and that others could reference as best practices or options for visualizing healthcare data.
In May 2018, I decided to launch Project Health Viz, a social data project to increase healthcare visualizations, provide a platform for others to practice and share healthcare vizzes, and to create a collection of related data sets for folks to access.
Project Health Viz
How it works:
- I post the data monthly to my data.world page and encourage people to share their visualizations and links in the discussion page as well as on Twitter (please tag me @ZenDollData and use the hashtag #ProjectHealthViz).
- At the end of the month I typically will blog about the data set, either focusing on a particular skill I tried, about how the community approached the data, which were my favorites, or something else!
- Once shared, the healthcare community, as a result, has a resource of visualization options that can help inspire us and keep us thinking about healthcare data in creative ways.
Building Your Passion
Through this process, I’ve learned a few key points that I want to pass along.
- Working with Tableau is amazing, but it’s even better with a strong network of people to help push you to grow, think abstractly, challenge your decisions, and congratulate your successes.
- If you can’t seem to find what you need, ask people. If it still doesn’t exist, then create it. “If you build it, they will come.” You need to be the owner of your destiny and seeking out those you consider to be your “tribe” or your identified “data fam”.
- Never cease to learn, challenge yourself, get involved, be vulnerable, and take risks. No one ever stumbled upon success simply by waiting for it to walk on by. Success is elusive – seek it out. Failure is the key to success as it gives you the opportunity to learn something new.
- Stay connected. Collaborate and develop insights. Laugh and learn with each other. Teach, inspire, absorb knowledge, and be inclusive.

This blog post is basically a summary of a talk I did at the Fanalytics session during the 2018 Tableau Conference.
Cheers,
Lindsay

One comment