

Joint Community Project
In January, I teamed up with Sarah Bartlett to combine #IronQuest and #ProjectHealthViz for the first month of 2020! We initially chatted for a bit trying to identify a topic that could meet the needs of both projects. We needed something that both was focused on healthcare, which I could obtain a data set for (since #ProjectHealthViz uses a specific data set each month) as well as a topic that people could be creative with and find their own data (which is what people typically do for #IronQuest).
We agreed on the topic: Healthcare in Prisons. This proved to be an interesting topic as people around the world identified various stories about the status of how prisoners experience the healthcare system.
The participant response was amazing. At the time, January’s #ProjectHealthViz had the most participants every and it had the second highest participant count for #IronQuest at 31 visualizations! You can read about the recap Sarah wrote here. The links to all 31 visualizations can be found there as well!
My visualization for January’s data focused on pregnancy in prison.


As many of you know, telling a compelling story that highlights the individual aspect of data is very important to me. A few days prior, I had seen Samo Drole’s Makeover Monday viz that used a very slick show/hide container with a button. Now, it’s not that I hadn’t used a show/hide container before. Trust me, I have a bunch. But what I loved, was how because he used a “side panel” when the container (and subsequent worksheet) showed itself, it appeared as if it expanded or came out of the side panel.

")
I use the show/hide container a ton, but let’s talk about how to use it as an “expansion panel” of sorts. But then, let’s take it one step further – I like to use these containers to show annotations. I also like to build everything IN Tableau. This means that, yes, I can create an image somewhere else (PowerPoint, Illustrator) and float that on top of my visualization, but what if we could create the entire annotation (with lines) in Tableau? Well, that’s what I wanted to do for this month’s project.
Creating a Show/Hide Container
The trick to creating a show/hide container is that you need to drag out a floating container (vertical or horizontal will do) and then place your worksheets or objects into the container which you want to show/hide as a result of a button. Once you have the objects in the container, select the container and then click on the arrow to reveal the options and select “Add Show/Hide Button”. By default, Tableau will provide you with an X and a “hamburger” (3 horizontal stacked lines) image to use as your show/hide icons. You can use custom images, however, to change the look and feel of your container buttons.

Okay, so yes, that’s how you create a show/hide container, but what about creating annotations IN Tableau that show/hide, NOT an image of your text created in another tool? Okay, I’ll tell you.
Learn to Love Containers
Containers are the bee’s knees, the cat’s pajamas, the best thing since sliced bread, and if you don’t know how you use containers… well then, stay tuned… I have a blog post in half production since November 2019 about containers that isn’t finished at this point. Point is, containers are very useful – particularly for this exercise.
The first thing to do is to identify where you need your annotations. Using squares and rectangles (containers, blank shapes, and text boxes) you can create any grid formation you want. Below you can see how using containers (typically not with borders) can structure your grid and allow you to place text in an exact area.

Containers, in Tableau, come in vertical and horizontal. Containers can be placed within each other. In the image below, you can see that the outermost container is a horizontal container and there are 4 elements within in – 3 additional containers and one blank box. I’ll admit, the naming convention is a bit confusing and I always seem to mix the containers and their result. Horizontal means you are placing items side-by-side along a “horizon” and vertical means you are stacking them up vertically. The good thing is, until you put something in the container, you can make it horizontal or vertical on the dashboard, regardless of which type you initially dragged out.


Containers are fantastic for a number of reasons:
- Allow for precise distribution and pixel-perfect sizing of your objects.
- You can use padding to create white space without the need to add in extra blank shapes.
- Using containers allows you to add in thin colored “lines” using a blank object sized to 11 pixels. Only within containers can you do this exact sizing of a tiled object.
- You can easily move entire groups of objects around your dashboard.
Creating Annotation Lines
In my visualization, I wanted to have lines to connect the annotation text to the chart. If I had needed straight lines, I could have done this with containers and thin blank shapes. However, I had a need for some diagonal lines due to the circular shape of my Voronoi chart.
As you can see in the image below, I have one large vertical container which has in it, one worksheet (the lines) and two horizontal containers. One of the two horizontal containers has two text boxes within it, and the other has two text boxes and a blank colored container. I probably could have used straight lines with text on the sides, but I wanted my text at the bottom given the space I had available.

In order to create the lines, I created a data source that simply gave me the x/y coordinates to create three lines. The “Birth Type” is really a “Line ID” used to distinguish which x/y coordinates go with which line. Then the “Path” tells Tableau in what order to connect the points.

Now that I had my lines, I had to put them together into my floating show/hide container along with my text annotations.
Creating Text Annotations with Connecting Lines in Tableau
As mentioned, I placed a floating vertical container out on my dashboard above my Voronoi chart. Within that container I added my annotation lines worksheet, then two horizontal containers with my text boxes.
The final part was to add in an additional line connecting my annotation line (the one on the far right) to the text box on the bottom. You can see in the image below, that what appears to be one line going from the small Voronoi chart to the lower text box, is really a combination of my line annotation worksheet and a blank filled container with padding.

What I’ve done is place a blank container and filled the background with the same color as the lines. Then, I adjusted the left and right outer padding to shrink the actual visual space of the blank container to only 2 pixels and to the exact location of my lines. This makes the line appear to go from the chart down to the text.
Once I had everything organized as desired, the last part was to make the large floating container into a show/hide container by selecting the container and in the dropdown menu in the top right, select “Add Show/Hide Button”.
Using custom images, I was able to create buttons that matched the color of my visualization. Below you can see how the show/hide container looks when activated.
You can view the full visualization here.
Other Examples
I’ve used the show/hide container and annotations a number of other times. Here are a few more examples of this trick in action.
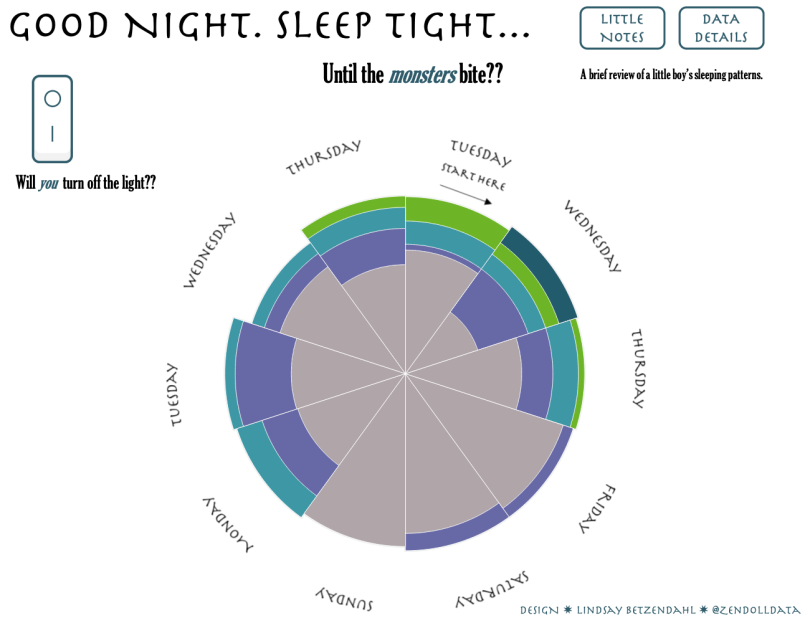
- Good Night, Sleep Tight – In this viz, I layered a duplicate of the worksheet that was entirely transparent (no color and opaque) so that I could use Tableau’s native annotation functions with lines.

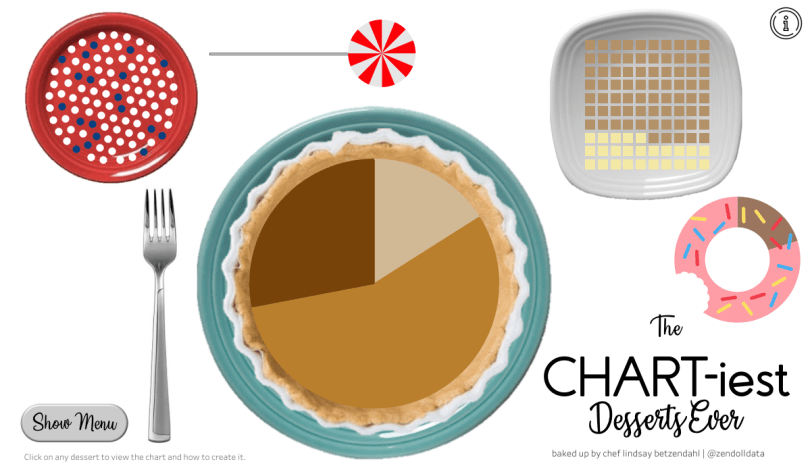
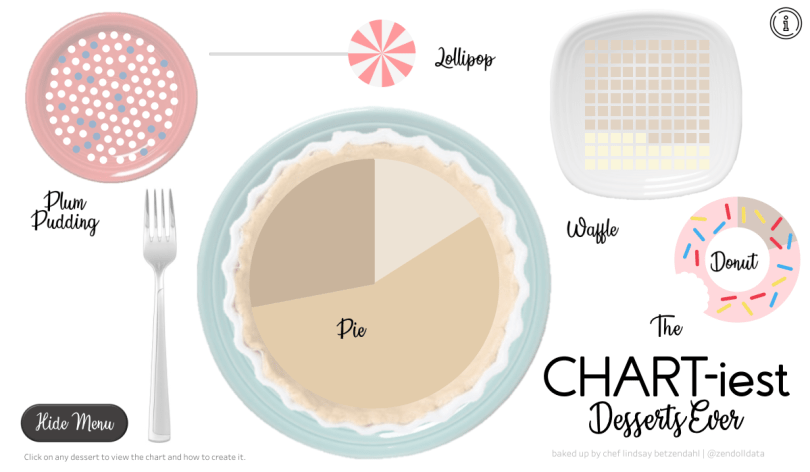
2. The Chartiest Desserts Ever – In this viz, I created a full image in PowerPoint that had the text in the exact place I needed them to show up and that was slightly opaque.
3. Pennsylvania COVID-19 Cases – In this viz, I used the show/hide container to allow the user to populate additional information.


Bottom line, I use this function A LOT! And if you don’t, I encourage you to find clever ways to use the show/hide button as well as use it to add helpful annotations to your viz.
Community Submission Favorites
As mentioned at the beginning of this post, the full list of all submissions are available on Sarah Bartlett’s blog, but I wanted to highlight my three favorite submissions this month because I’ve very thankful for everyone who participated.
Swati Dave – I really like how Swati used both space and color in this visual. Simple charts, clear text, defined sections, and symmetry make this viz engaging and easy to understand. I appreciate when people use Gestalt principles (color and symmetry here) to improve a visualization.

Meera Umasankar – Meera has a keen eye for visual design and I love how she has used simple chart types and has removed all unnecessary clutter. Meera also used the Gestalt principle of enclosure in many places. This really helps to frame each section and draw attention. Her use of big numbers helps her viewer to quickly process the data.

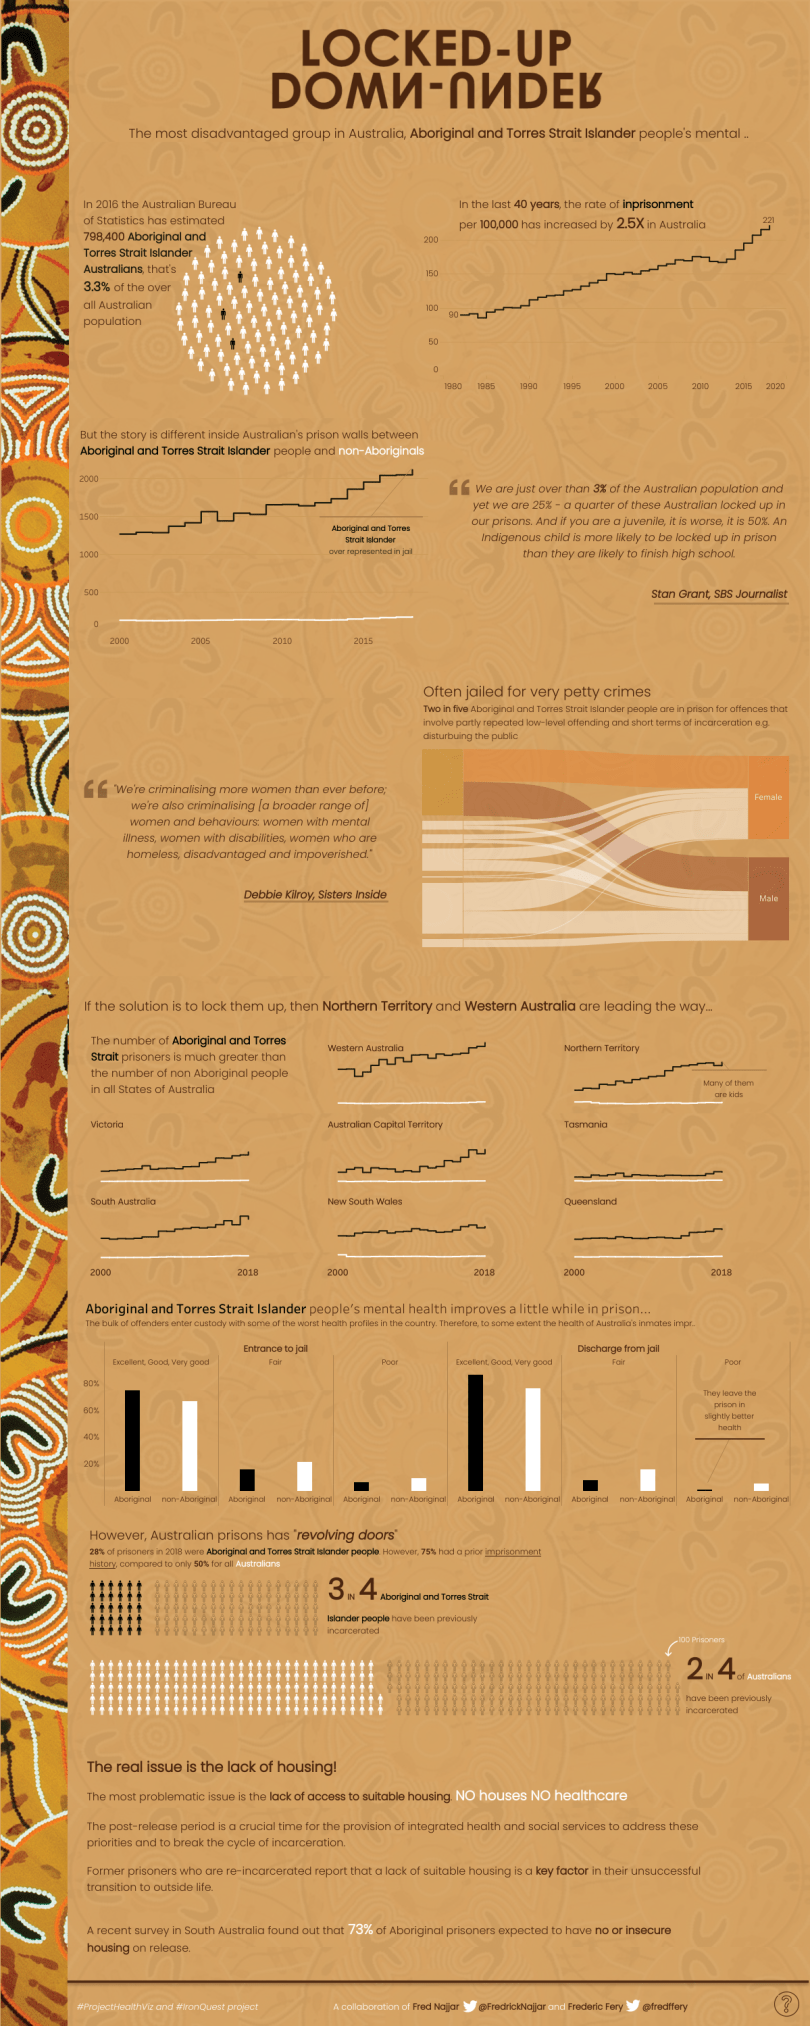
Frederic Fery & Fred Najjar – Frederic and Fred teamed up for a collaborative viz this month and I love the uniqueness of this display. Unlike other vizzes I’ve seen, they chose to use a background pattern. Typically, I’d find this distracting, but it really works with the theme and is faint enough to add an emotional layer to the viz. I think this viz uses space really well and breaks up some of the data with powerful quotes. I like how they used the step line charts throughout and reduced a lot of unnecessary data ink from each chart.
Thanks to everyone who participated this month!
Cheers,
Lindsay

useful article
LikeLiked by 1 person