

If you read my previous blog post you know that last month I launched #ProjectHealthViz, which is an initiative that means a lot to me as someone who works in the healthcare industry. Ultimately, I felt that there was an under-representation of a very important topic amidst the Tableau Public vizzes I saw in the wild: Healthcare, and even more specifically, mental health.
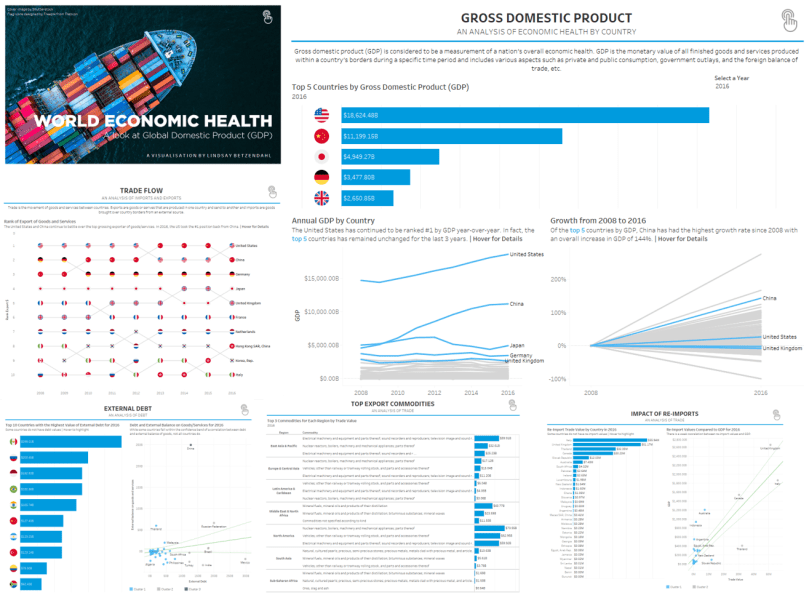
I find it always helpful to try your skills at a data set topic that is less familiar to you. Recently, I was asked to produce a dashboard on Gross Domestic Product (GDP). To be completely transparent, I barely know what that means. “Barely” might be an overstatement.
So despite the fact that financial and global trade data is not my expertise, I really started to enjoy the process of visualizing the data. Why? Because it stretched my inner data muscles and creative thinking. I did a little research into the concept, visualizations on the topic (including infographics, which I often turn to for inspiration), and general questions asked of similar data. It was a good exercise in trying to understand and visualize something new. In the field of data analytics and visualization, we are often asked to work on projects unfamiliar to us. It’s important to understand the steps involved, including learning about the data, asking the end user about their needs and questions they want to answer, utilizing chart types most appropriate for the topic, etc.
I’m very thankful for the Tableau community that participated this month in #projecthealthviz!! There are now six (including mine) additional healthcare Tableau visualizations out in the wild!! I’m also impressed with the different takes on the data. At a minimum, I hope those that participated learned something new and will continue along this journey with me.
The visualizations from May are posted below with the author’s link. June’s data set can now be found here and looks at child mortality rates from the World Health Organization. Remember to post here in the discussion and/or on Twitter using the hashtag #projecthealthviz and tag me @ZenDollData. Thanks!!
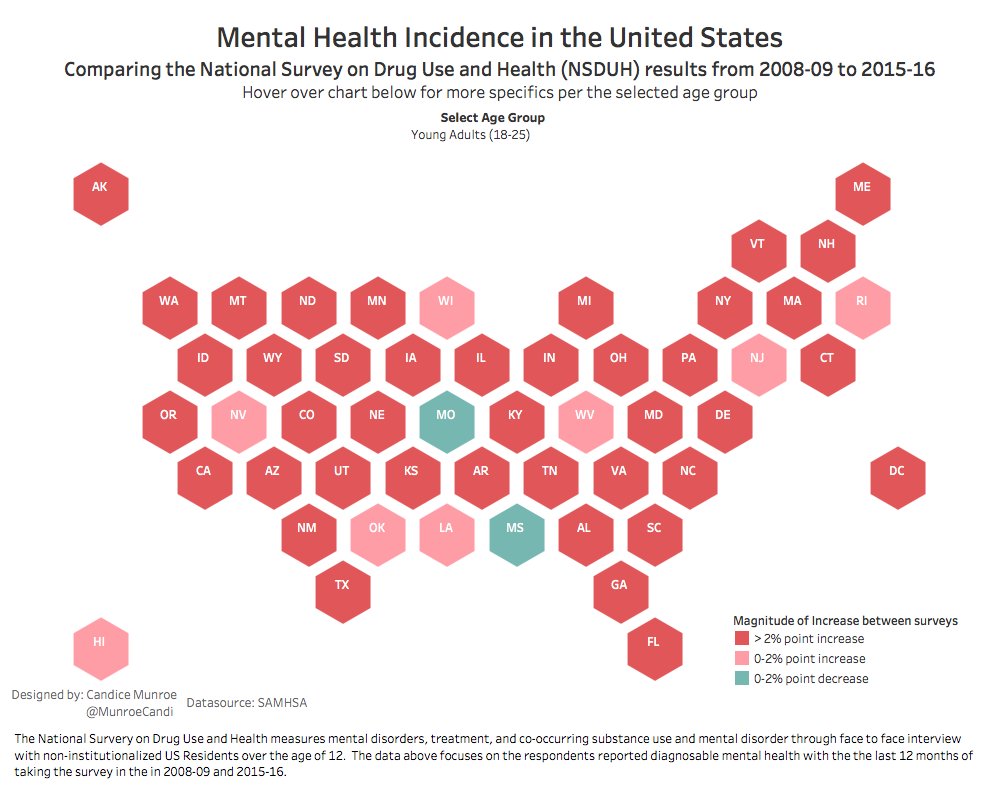
By Candi (@MunroeCandi): Link to Viz

By Steve Riffe (@RiffeSteve): Link to Viz
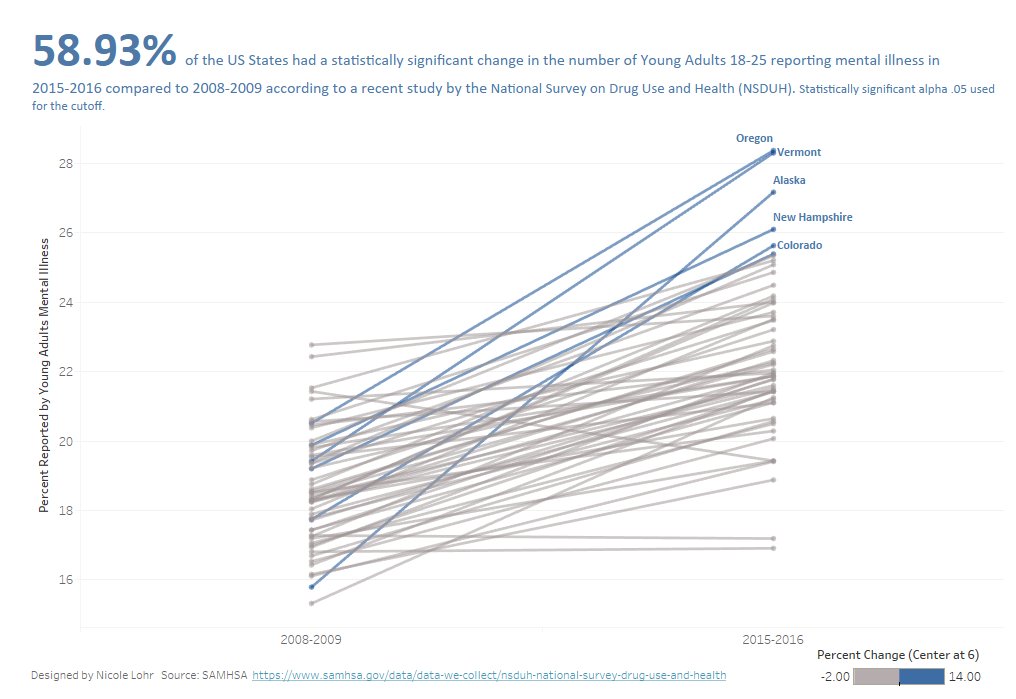
By Nicole Lohr (@nicole_lohr9): Link to Viz

By Sean Ramsdale (@GreyRamAnalytic): Link to Viz

By Rodrigo Calloni (@Tableauing): Link to Viz
