
Modern Dashboards
Modern dashboard designs are all the rage right now. The design layout and functionality often take concepts from web design and mobile application user experience (UX) and user interface (UI) design.
A quick Google, Pinterest, or Dribbble search will bring up a ton of gorgeous layouts with smooth interactivity and interfaces.

Recently, I created a dashboard using Tableau’s Superstore data set to show students in the MBA course I’m teaching at Temple University how to create some advanced dashboard techniques. During the development of that dashboard, I utilized a side panel to focus a variety of small summary graphs. The side panel is just a simple shape created in PowerPoint using a gradient color fill with two custom buttons with a similar shape and the same gradient.

The above dashboard, actually has a ton of fun technical features including indicator icons, set actions, parameter actions, action filters, navigation buttons, dual axis charts, custom calculations, and LODs. These are the techniques I was teaching my students, not the “modern dashboard” approach. However, in the public and social media space, folks were very interested in the look of the dashboard.
I’ve said all along, that a dashboard needs to look good to engage a viewer. I tell my students that formatting may seem tedious, but a clean dashboard is one that people want to interact with. It’s important to have a clean and beautiful design to bring people in and the data analysis to make them stay. Just like you don’t want to eat in a dirty, disorganized restaurant, you don’t want to explore a disorganized, inconsistently formatted, and poorly designed dashboard.
All that is to say, make engaging visuals, but don’t only focus on the design. Your work needs to also have sound analyses and appropriate chart types.
I’m sure we will continue to see these types of dashboards, and I’m excited to see what people come up with!
However, this blog post is about how to create a halo effect around a bar chart to highlight the largest value. You can see this in the image below. The darker pink halo surrounds the bar that is the highest in the range and will adjust with the set action filters from the above buttons. So let’s get to that!

Honesty Disclosure
Let’s be honest – we all steal ideas. And by “steal” I mean we are “inspired”. Austin Kleon, author of Steal Like an Artist, states that nothing is original. “Every artist gets asked the question, ‘Where do you get your ideas?’ The honest artist answers, ‘I steal them.'”
Every artist gets asked the question, “Where do you get your ideas?” The honest artist answers, “I steal them.” – Austin Kleon
So when I was searching around for the nugget of “inspiration,” I came across this design. Don’t freak out. Yes, my design looks identical. That’s because it is, and that was my intent. Why would I directly copy? Two reasons.
- I liked the design and colors.
- I wanted to see if I could build it exactly in Tableau even if it had elements that weren’t obviously easy to create it Tableau – which means, I wanted a challenge.

So the first thing I thought was interesting, was that “halo” effect on one of the slim bar charts. I thought… hmmmm… that could be useful. Let me see if I can build that in Tableau. In fact, I was building a dashboard for a client and thought I could use it there. But I wanted to start with my own viz to test out the idea. And so here we are. Let’s learn how to do it!
Creating a Halo Highlight Effect
The halo effect uses two techniques: table calculations (WINDOW_MAX) and a dual axis chart (one a bar and one a line).
To start, make your bar chart. If you are following along and using Superstore, then simply put discrete MONTH([Order Date]) on Rows, add SUM([Sales]) onto the Columns shelf, and then change the mark type to a bar. In my example, I limited my view to one year, which you can do or not, but I just wanted each month for a calendar year. Up to you!

Next we need to create a calculation which we can use as our halo. I want it only to be true if the value is the maximum value for the available range in the view.
We can use a table calculation for this.
Max Background Highlight:
IF
WINDOW_MAX(SUM([Sales]))=SUM([Sales])
THEN SUM([Sales]) ELSE -1 END
In order to make the halo effect, we need a dual axis chart which uses a thick line connecting a lower value (we will use 0) and the max value. The line actually gives us the rounded shapes at the end.
So next we need to add Measure Values to the Rows shelf. Then type in the value into the Measure Values shelf MIN(0) and remove all measures except for the Max Background Highlight.

Now we have all the required parts. The next step is to make a dual axis with synced axis ranges. Change the Measure Values mark to a line and add Measure Names to Path. Make sure that your bar is set to be in the front. If not, click on the axis and select “Move Marks to Front”.
Then we need a color calc to only highlight the max value on our halo line because otherwise there will be a circle at the zero value for each bar, which we don’t want.
Max Color:
IF [Max Sales Background highlight]>=0 then ‘color’ else ‘fade’ END
We can put this color on the Measure Values mark, which will give us this.

Lastly, we need to format the colors, so that the circle value doesn’t show up. This means either make it white, or the same color as your background in your dashboard.
Once on the dashboard, you can float a blank box over the bottom section of the chart so that the lower circles aren’t selectable. You can see the floating box in the image below over the months.
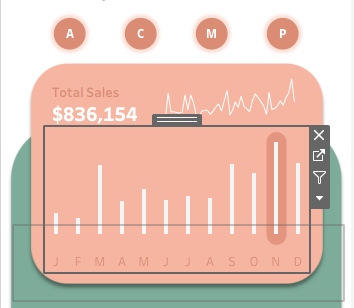
Now, when the filters are changed the halo will move to the maximum bar. Essentially, I’m using preattentive attributes to add a bit of “look here” to quickly pull out the maximum month. While the bar’s length tells us which bars are high or low, this halo effect can provide a bit more of a visual cue to draw in attention.

You can check out the full viz here. I’ll have a follow-up blog post on how to do show the Region and the max state value in the same table as you can see in the below section of this viz.
If you have questions or use this technique, please let me know! I’d love to see it.
Cheers,
Lindsay

Really nice design,
LikeLiked by 1 person
Reblogged this on GxSoft Opinions.
LikeLike